How did the eclipse impact your solar assets?
Whilst many people had a busy day experiencing the eclipse, those responsible for managing solar assets around the country will have been closely watching and managing as asset generation was impacted significantly. The video above shows data from Solcast’s GHI parameter across the day. This shows that the whole continent was impacted by this eclipse, and whilst the path of totality got most of the focus, every solar asset and grid across Mexico, the US and Canada were impacted.
To view how the eclipse, and cloud, impacted solar assets around the US, you can use Solcasts eclipse cloud forecast map to see the last cloud forecast issued before the eclipse, on a map that includes data for solar assets over 6MW. To learn more about how our cloud tracking models are able to produce high resolution nowcasts, you can learn more about that here, or get in touch with our team to discuss how high-resolution data built for solar can help your teams.
Eclipse and Weather impacts on Grids across the US
Texas Grid Impacts (ERCOT)
Texas saw more cloud than might have been expected by many eclipse chasers who made plans before forecasts were available. Cloud in the south and east of the state impacted solar generation, but the north and west was broadly clear.
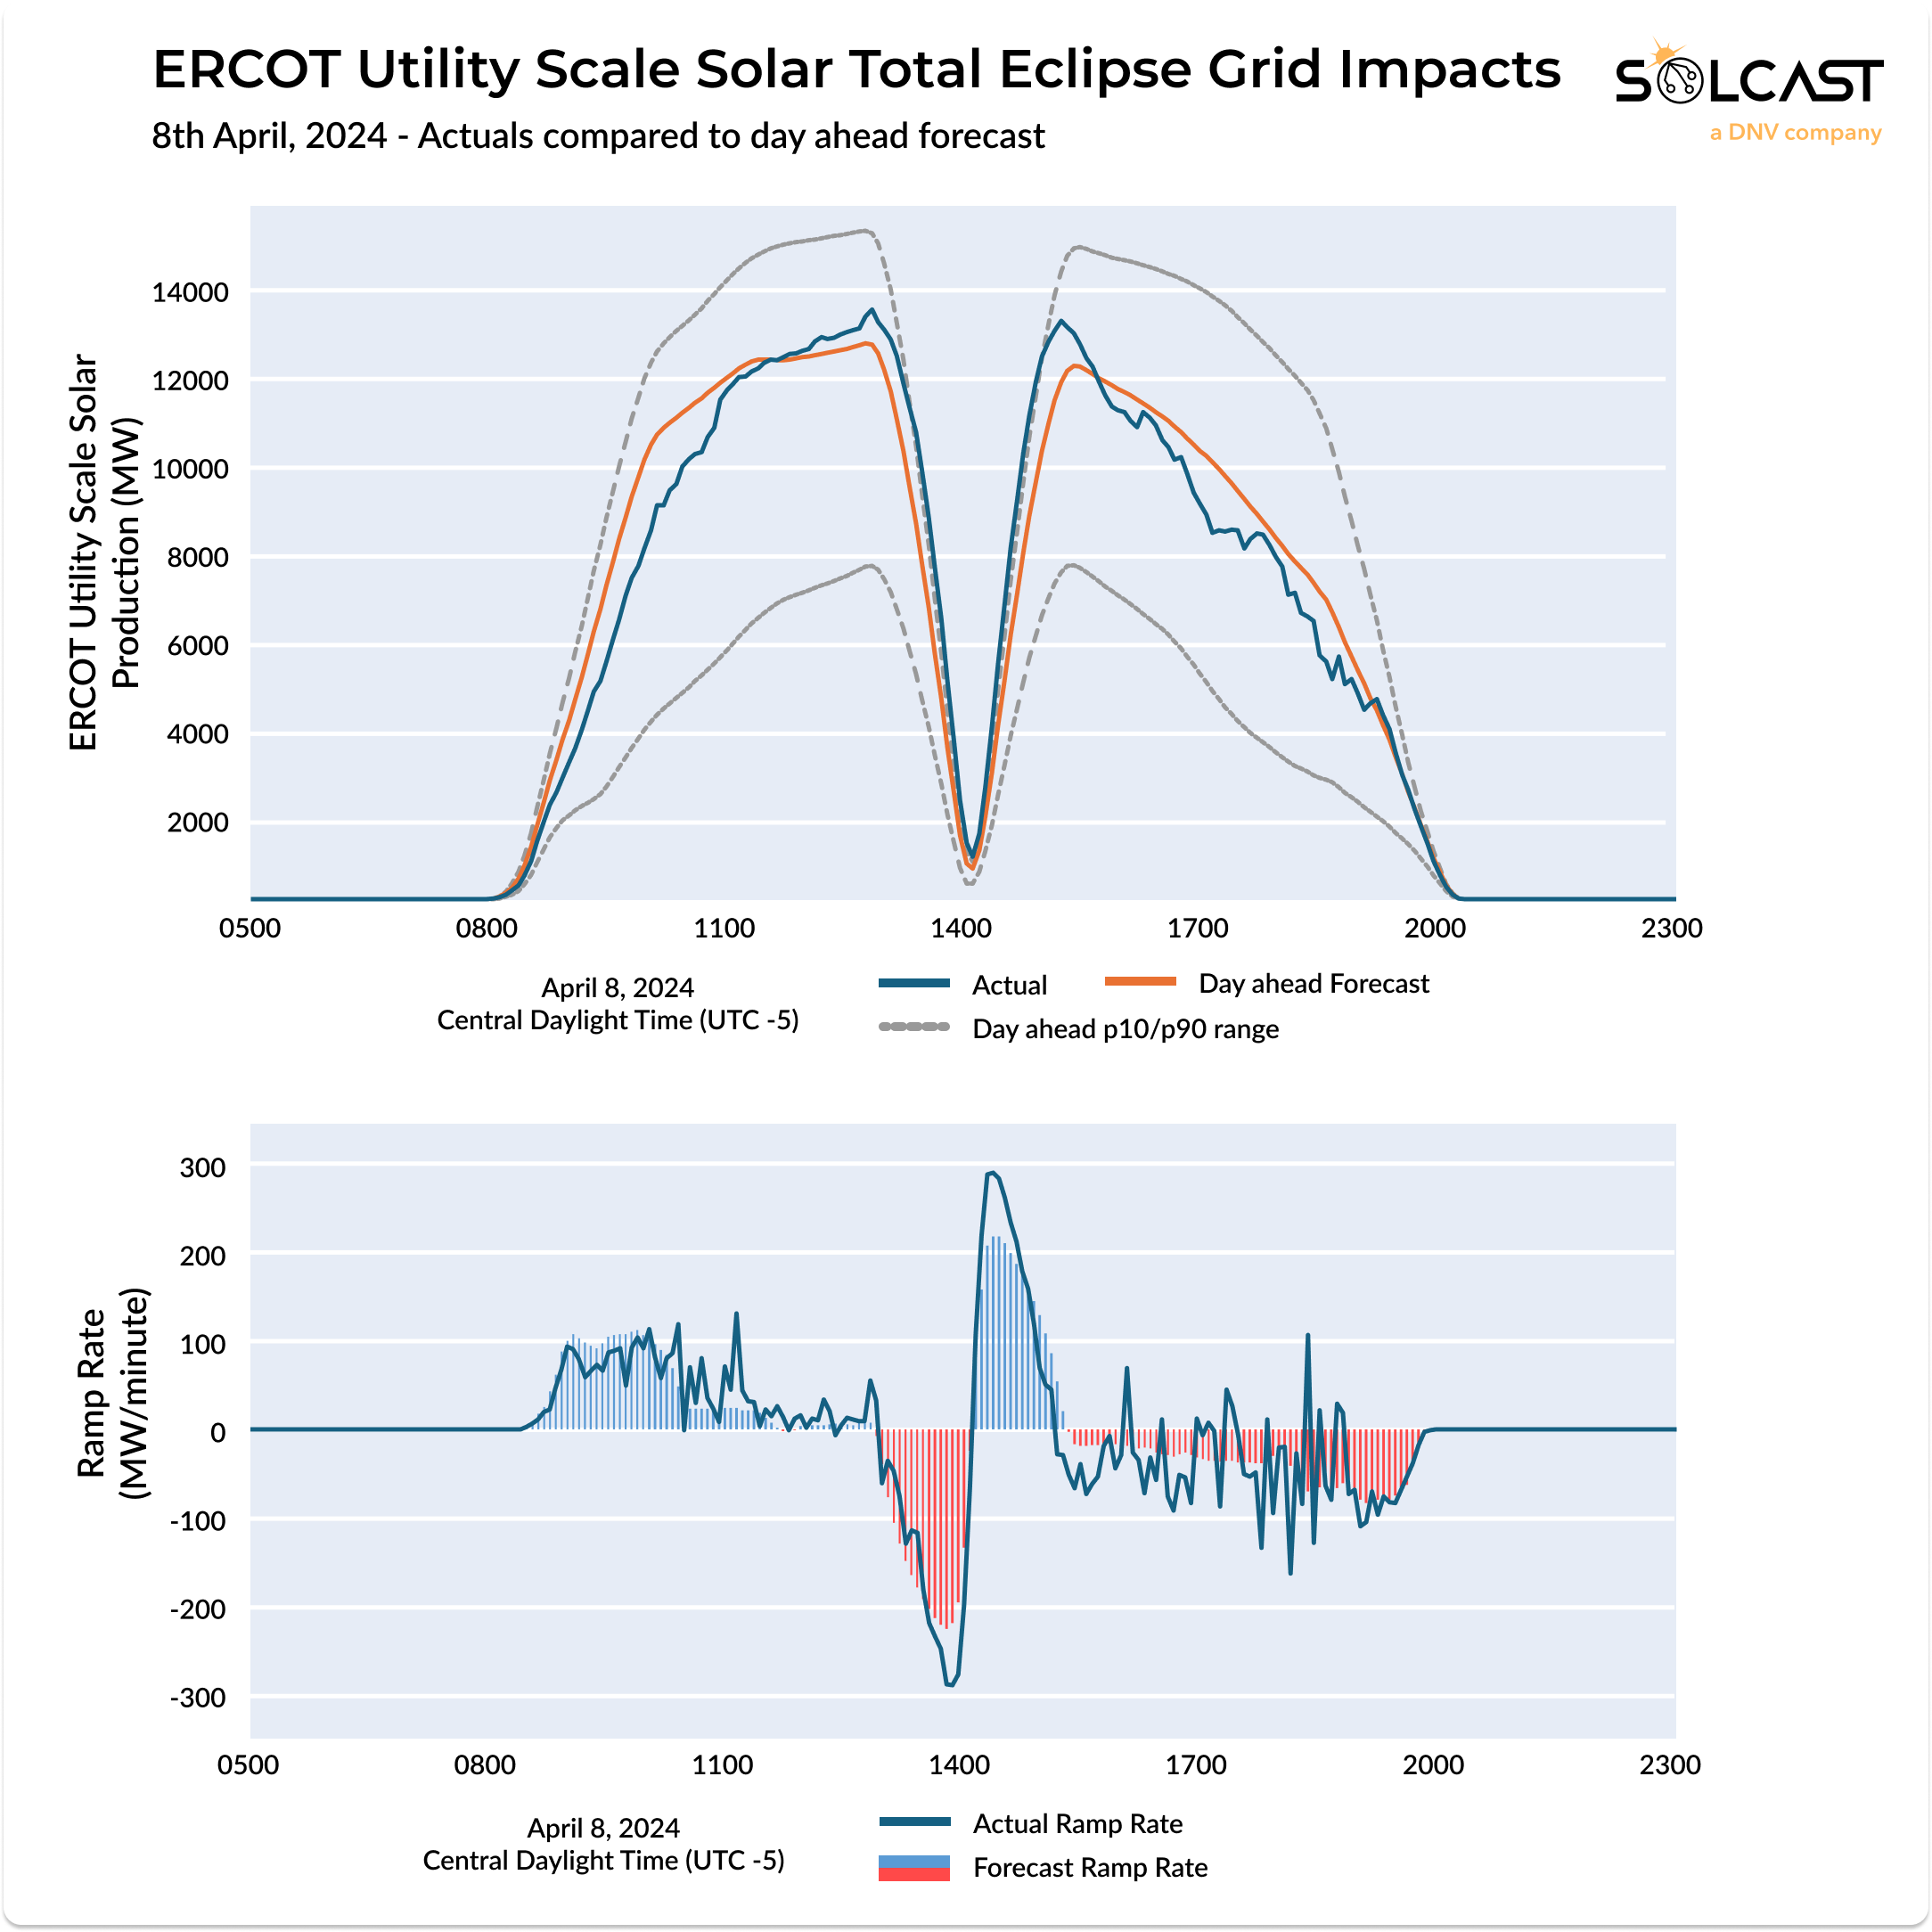
ERCOT generation mix statistics show that the majority of the drop in solar was made up in gas, though power storage also played a role.
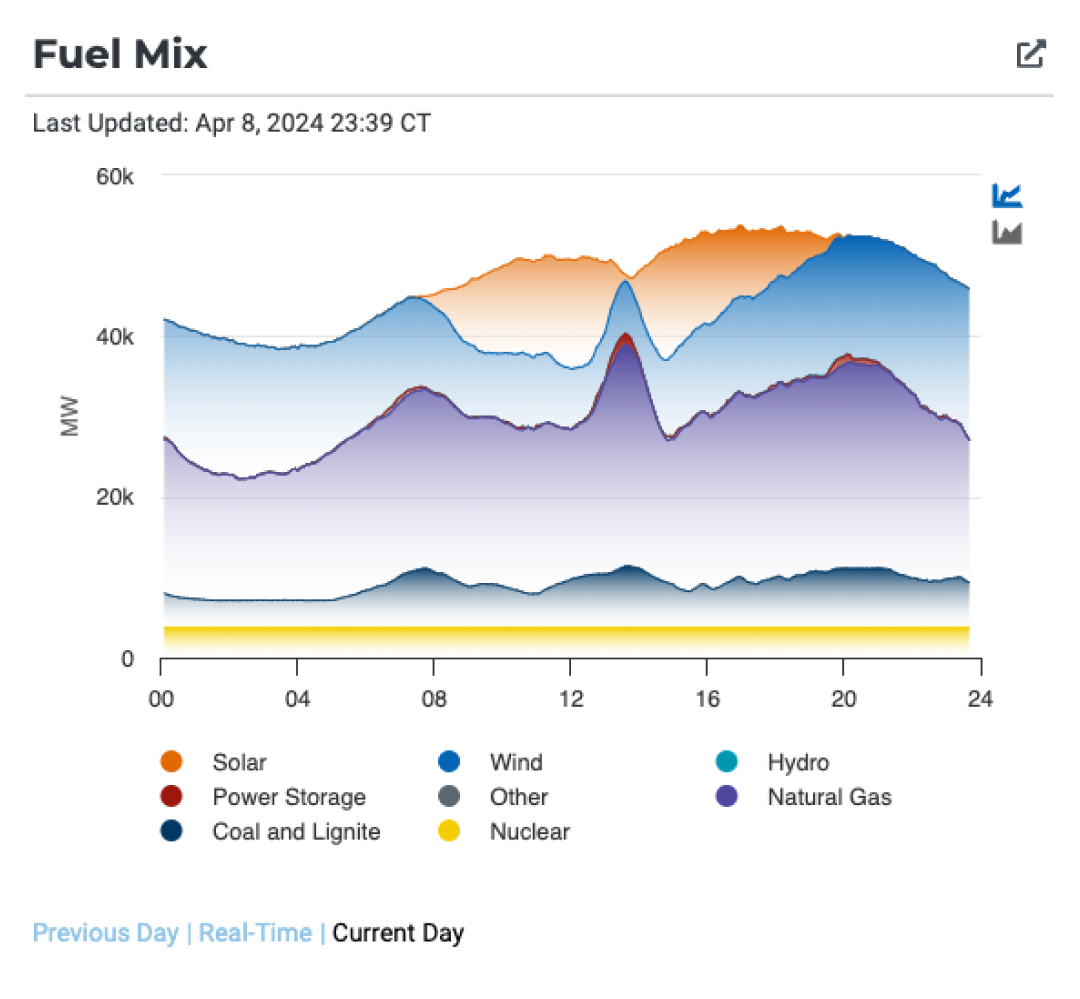 Source: ERCOT
PJM Impacts (ERCOT)
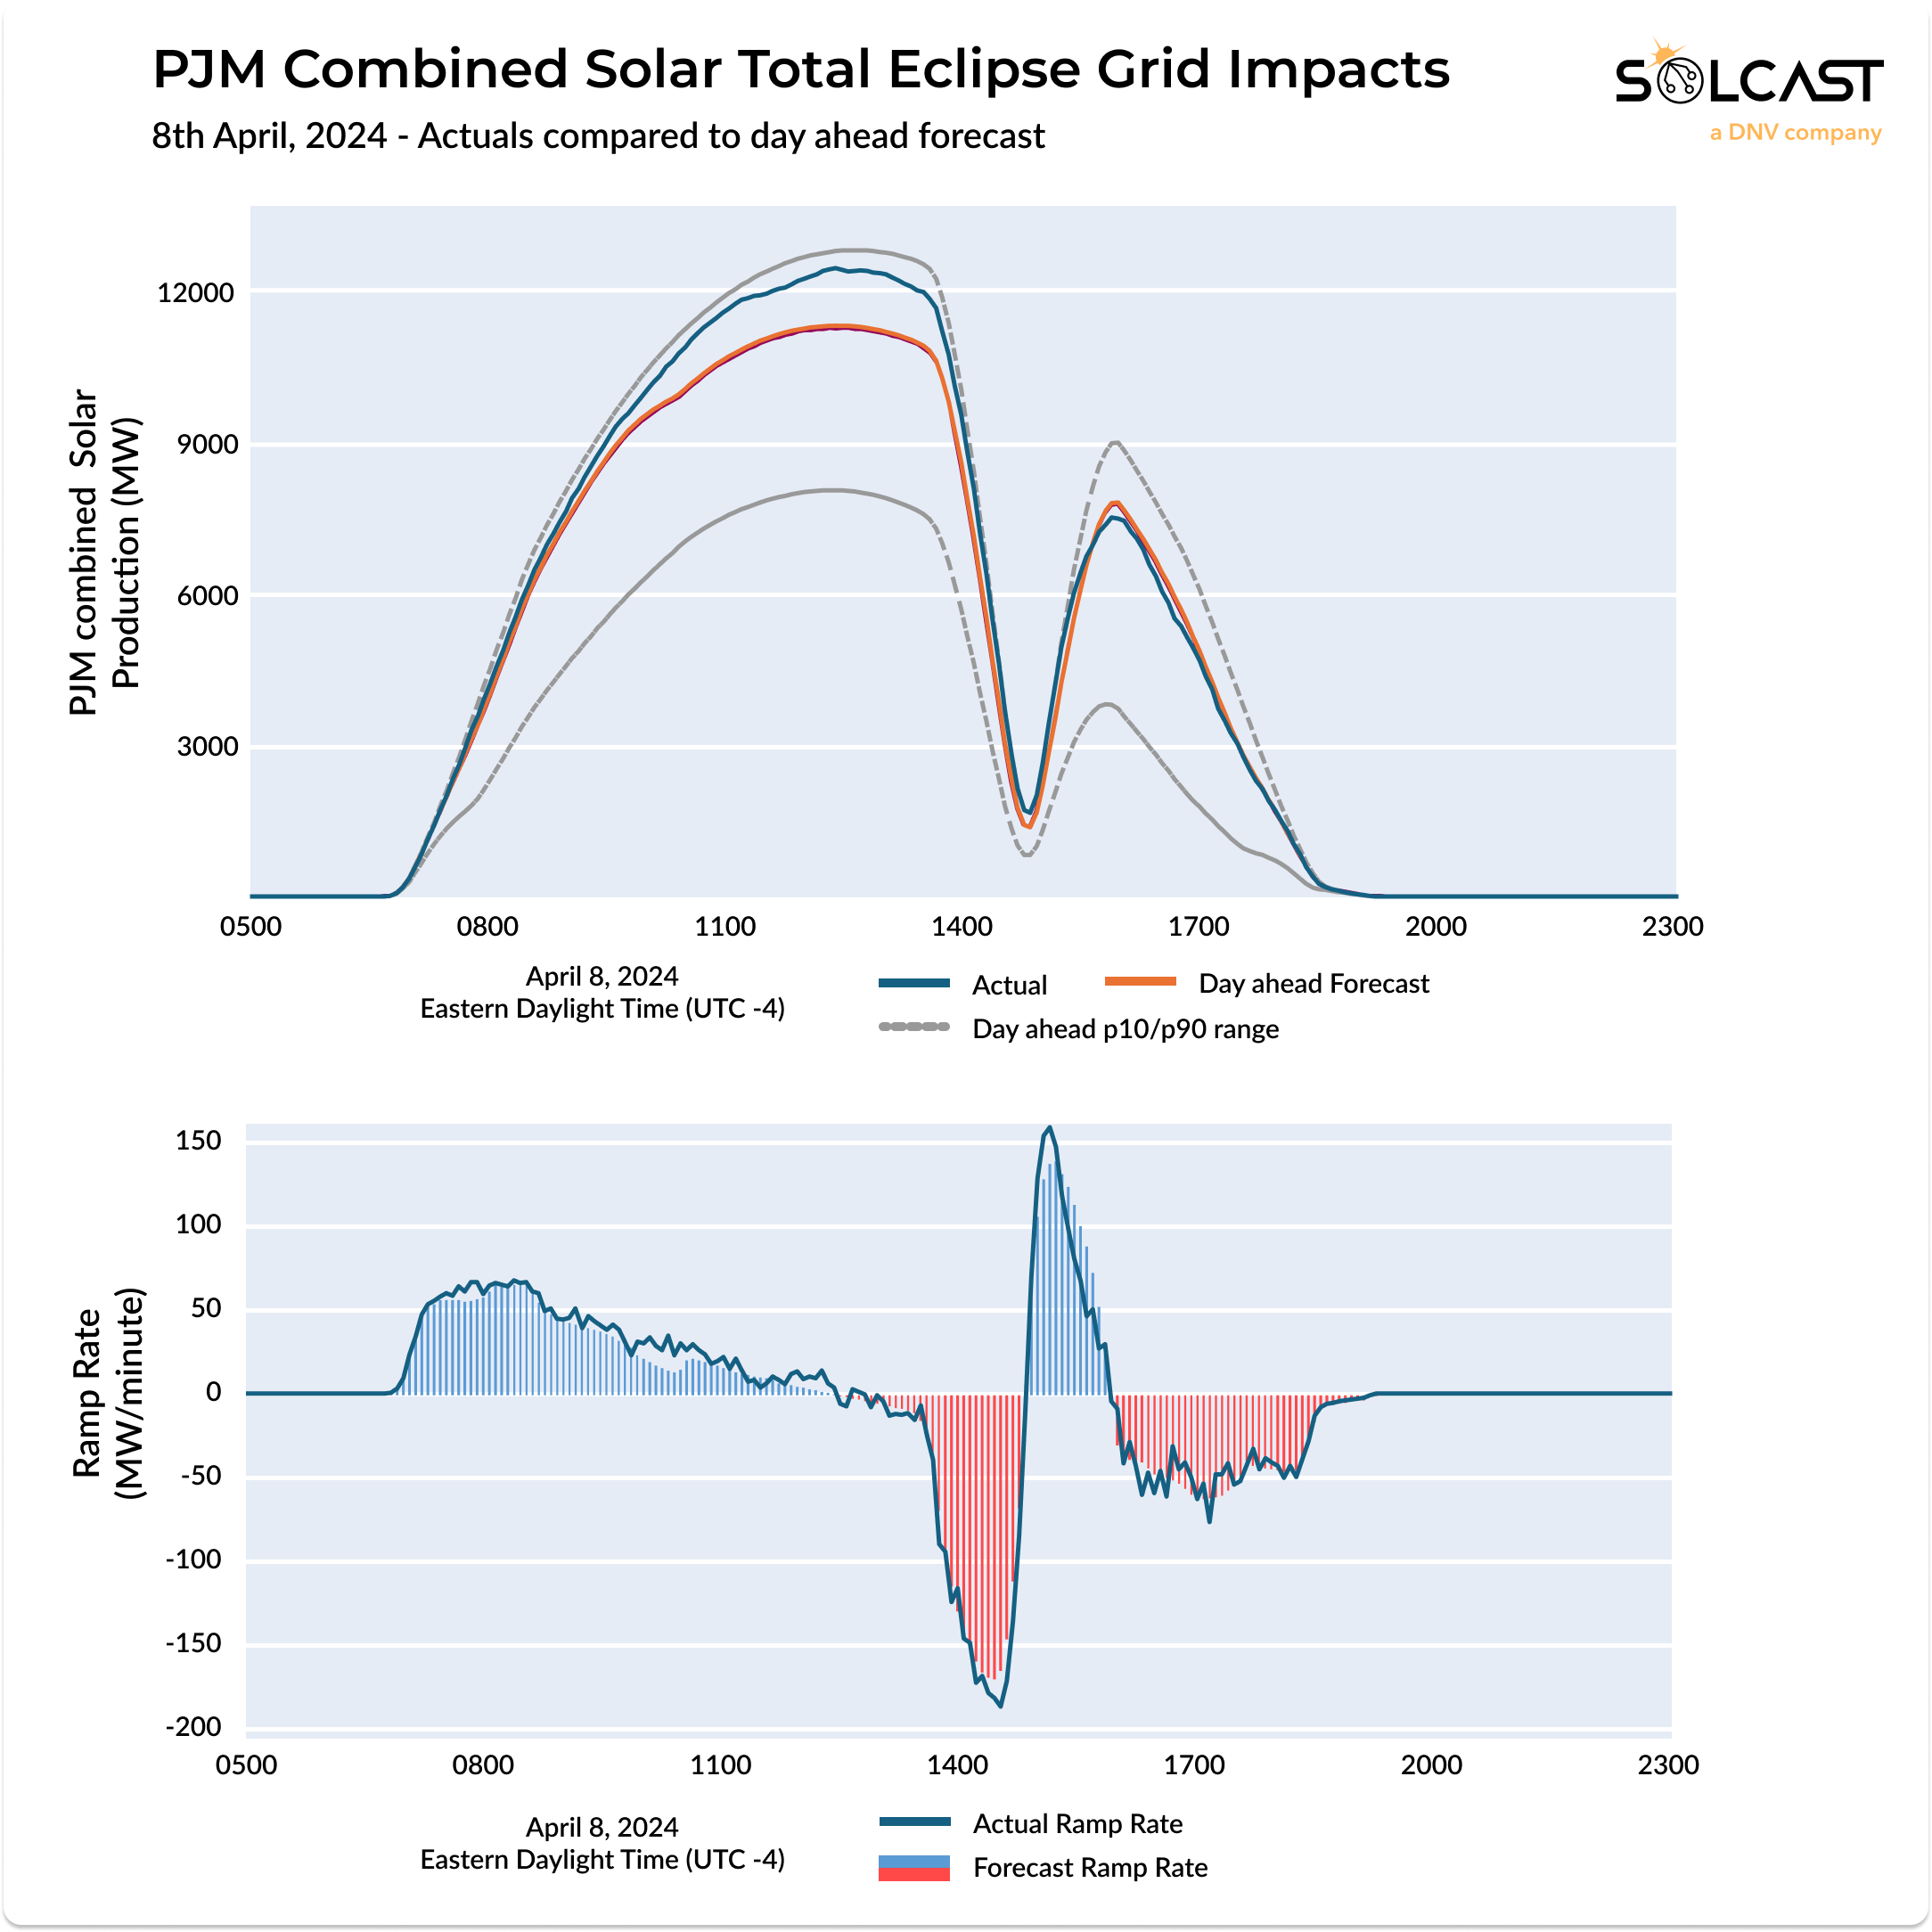
Cloud over the midwest ended up being lighter than expected, and actuals for solar were closer to the top of the p90 forecast from a day earlier. This is good news for eclipse viewers across the region, though it meant that the peak ramp rate was slightly more than originally expected, peaking at more than 150 MW/minute.
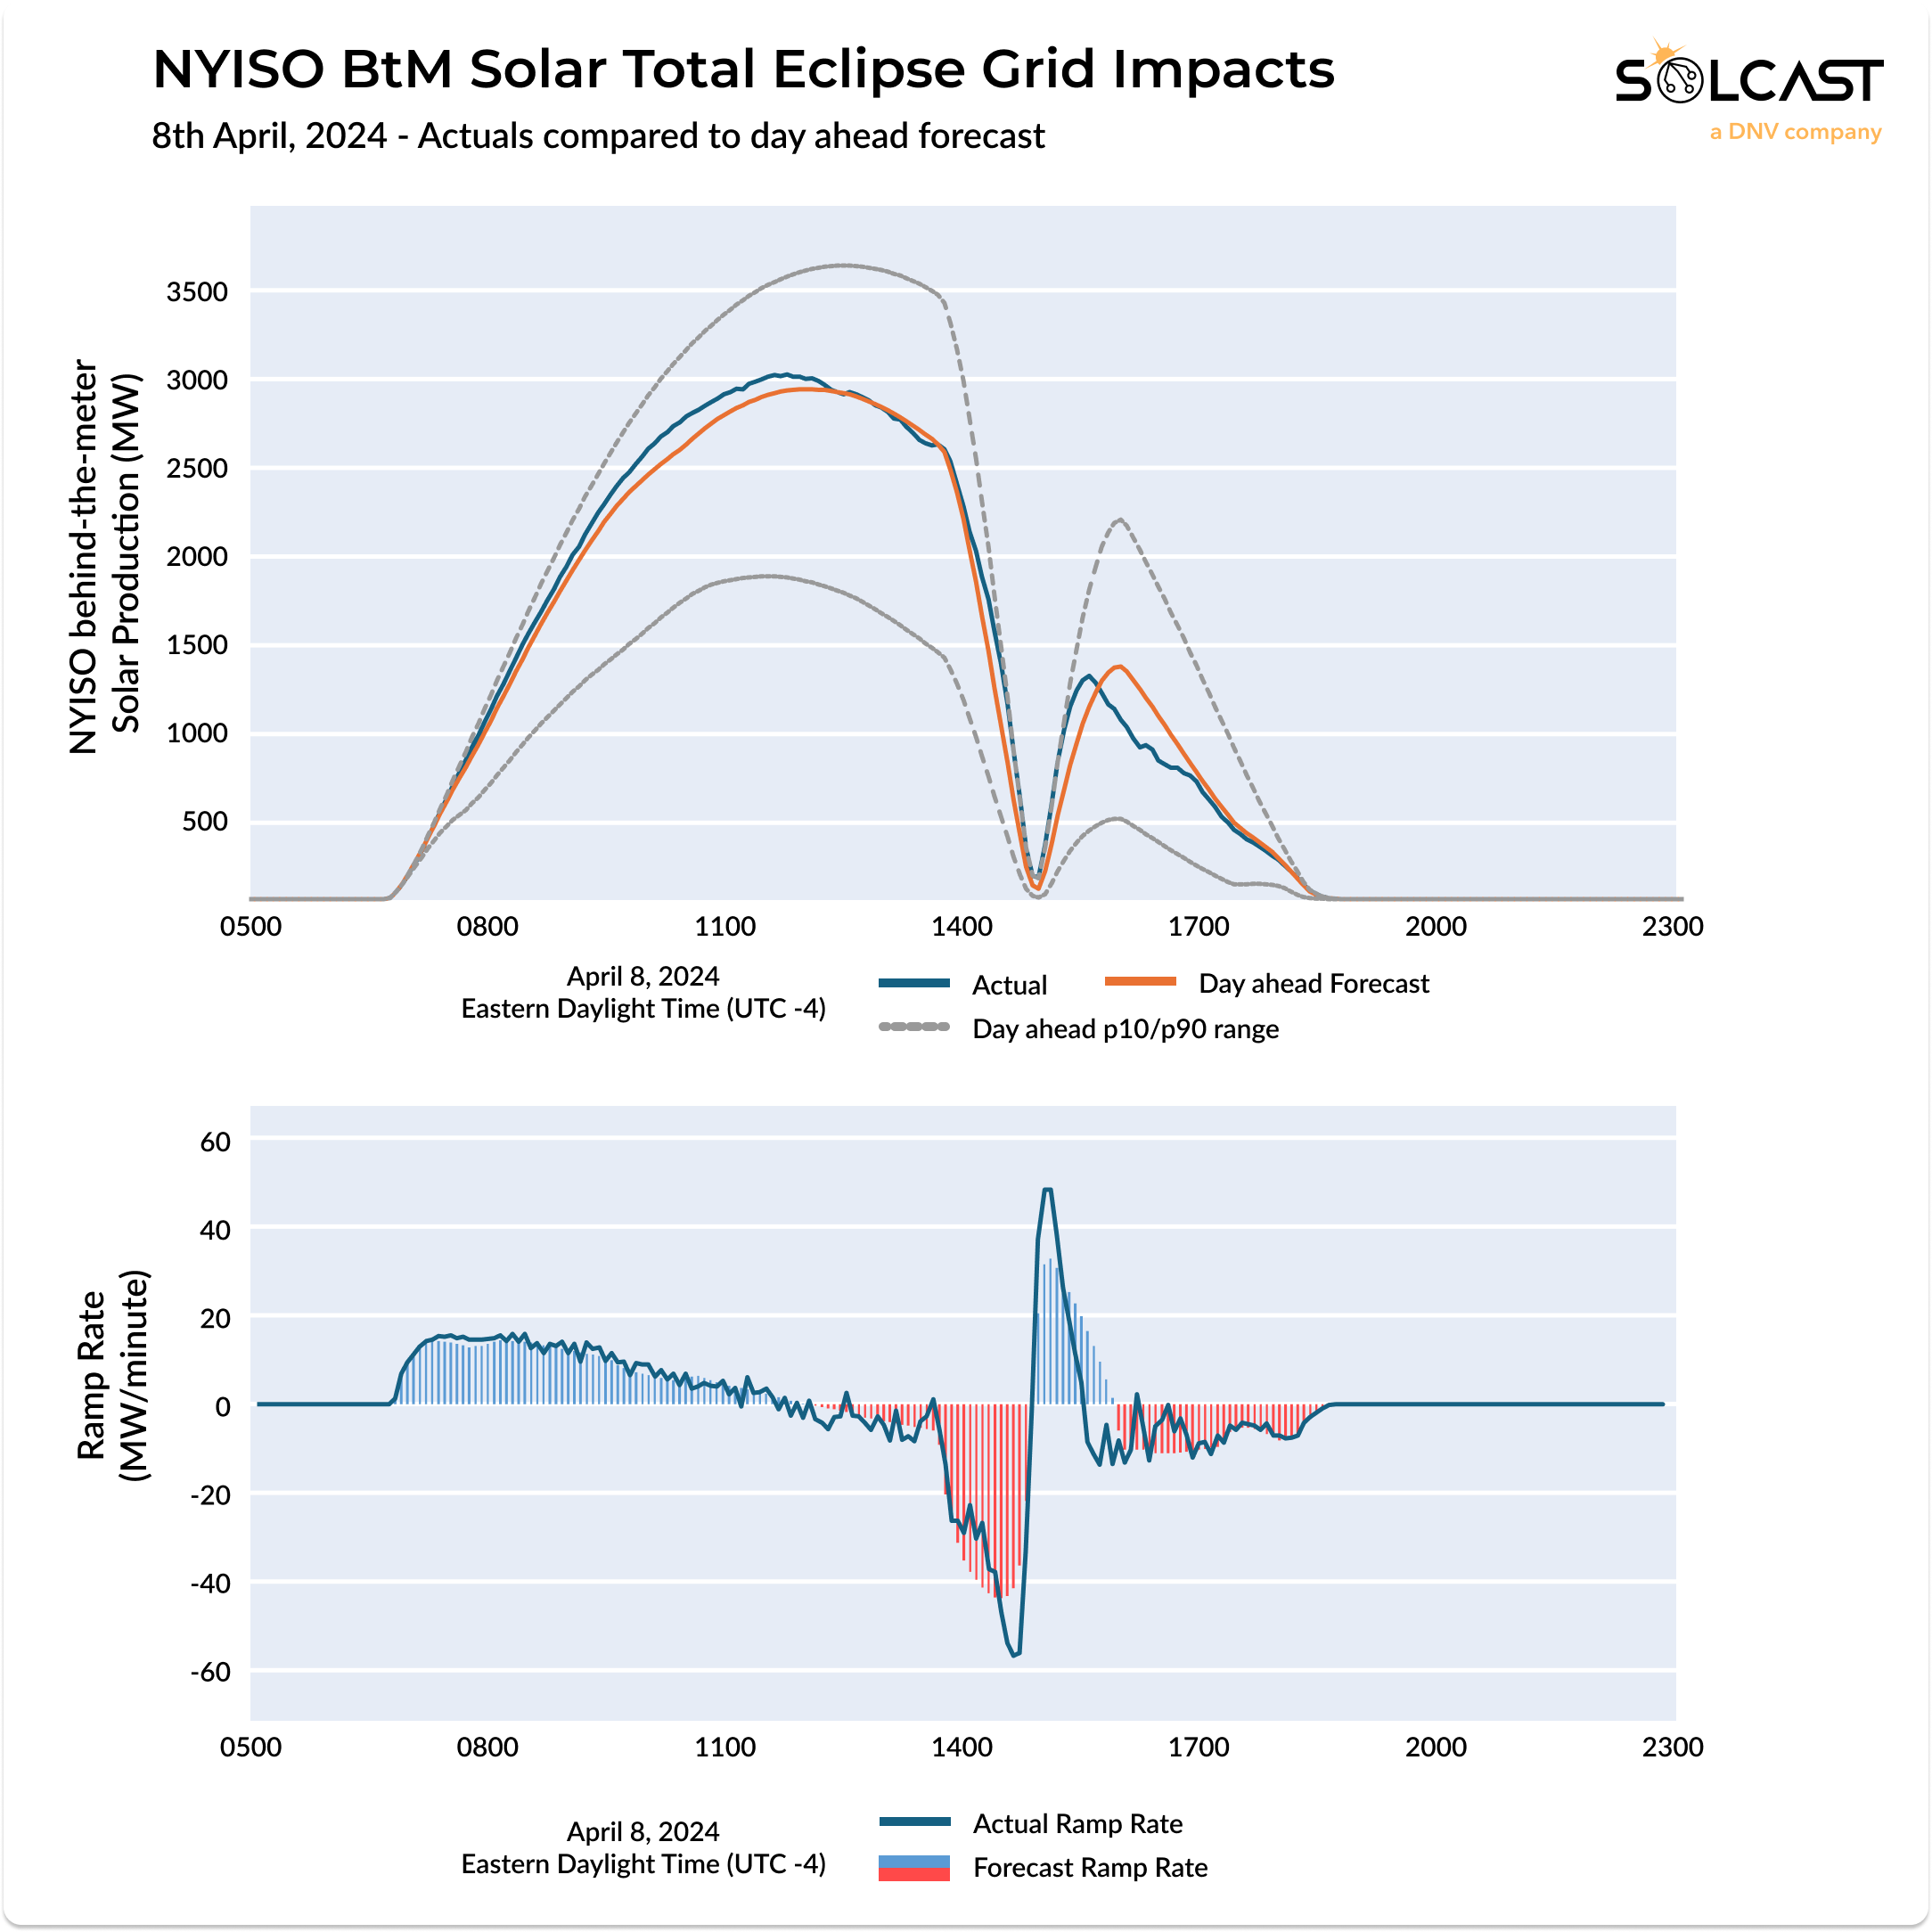
New York Grid Impacts (NYISO)
New York behind-the-meter solar generation stayed roughly as forecast, with some cloud coming over right before the eclipse totality passed. Minor variations and bumpiness as seen here is normal with high-resolution data, as small bands of clouds move over high-density areas of solar capacity.
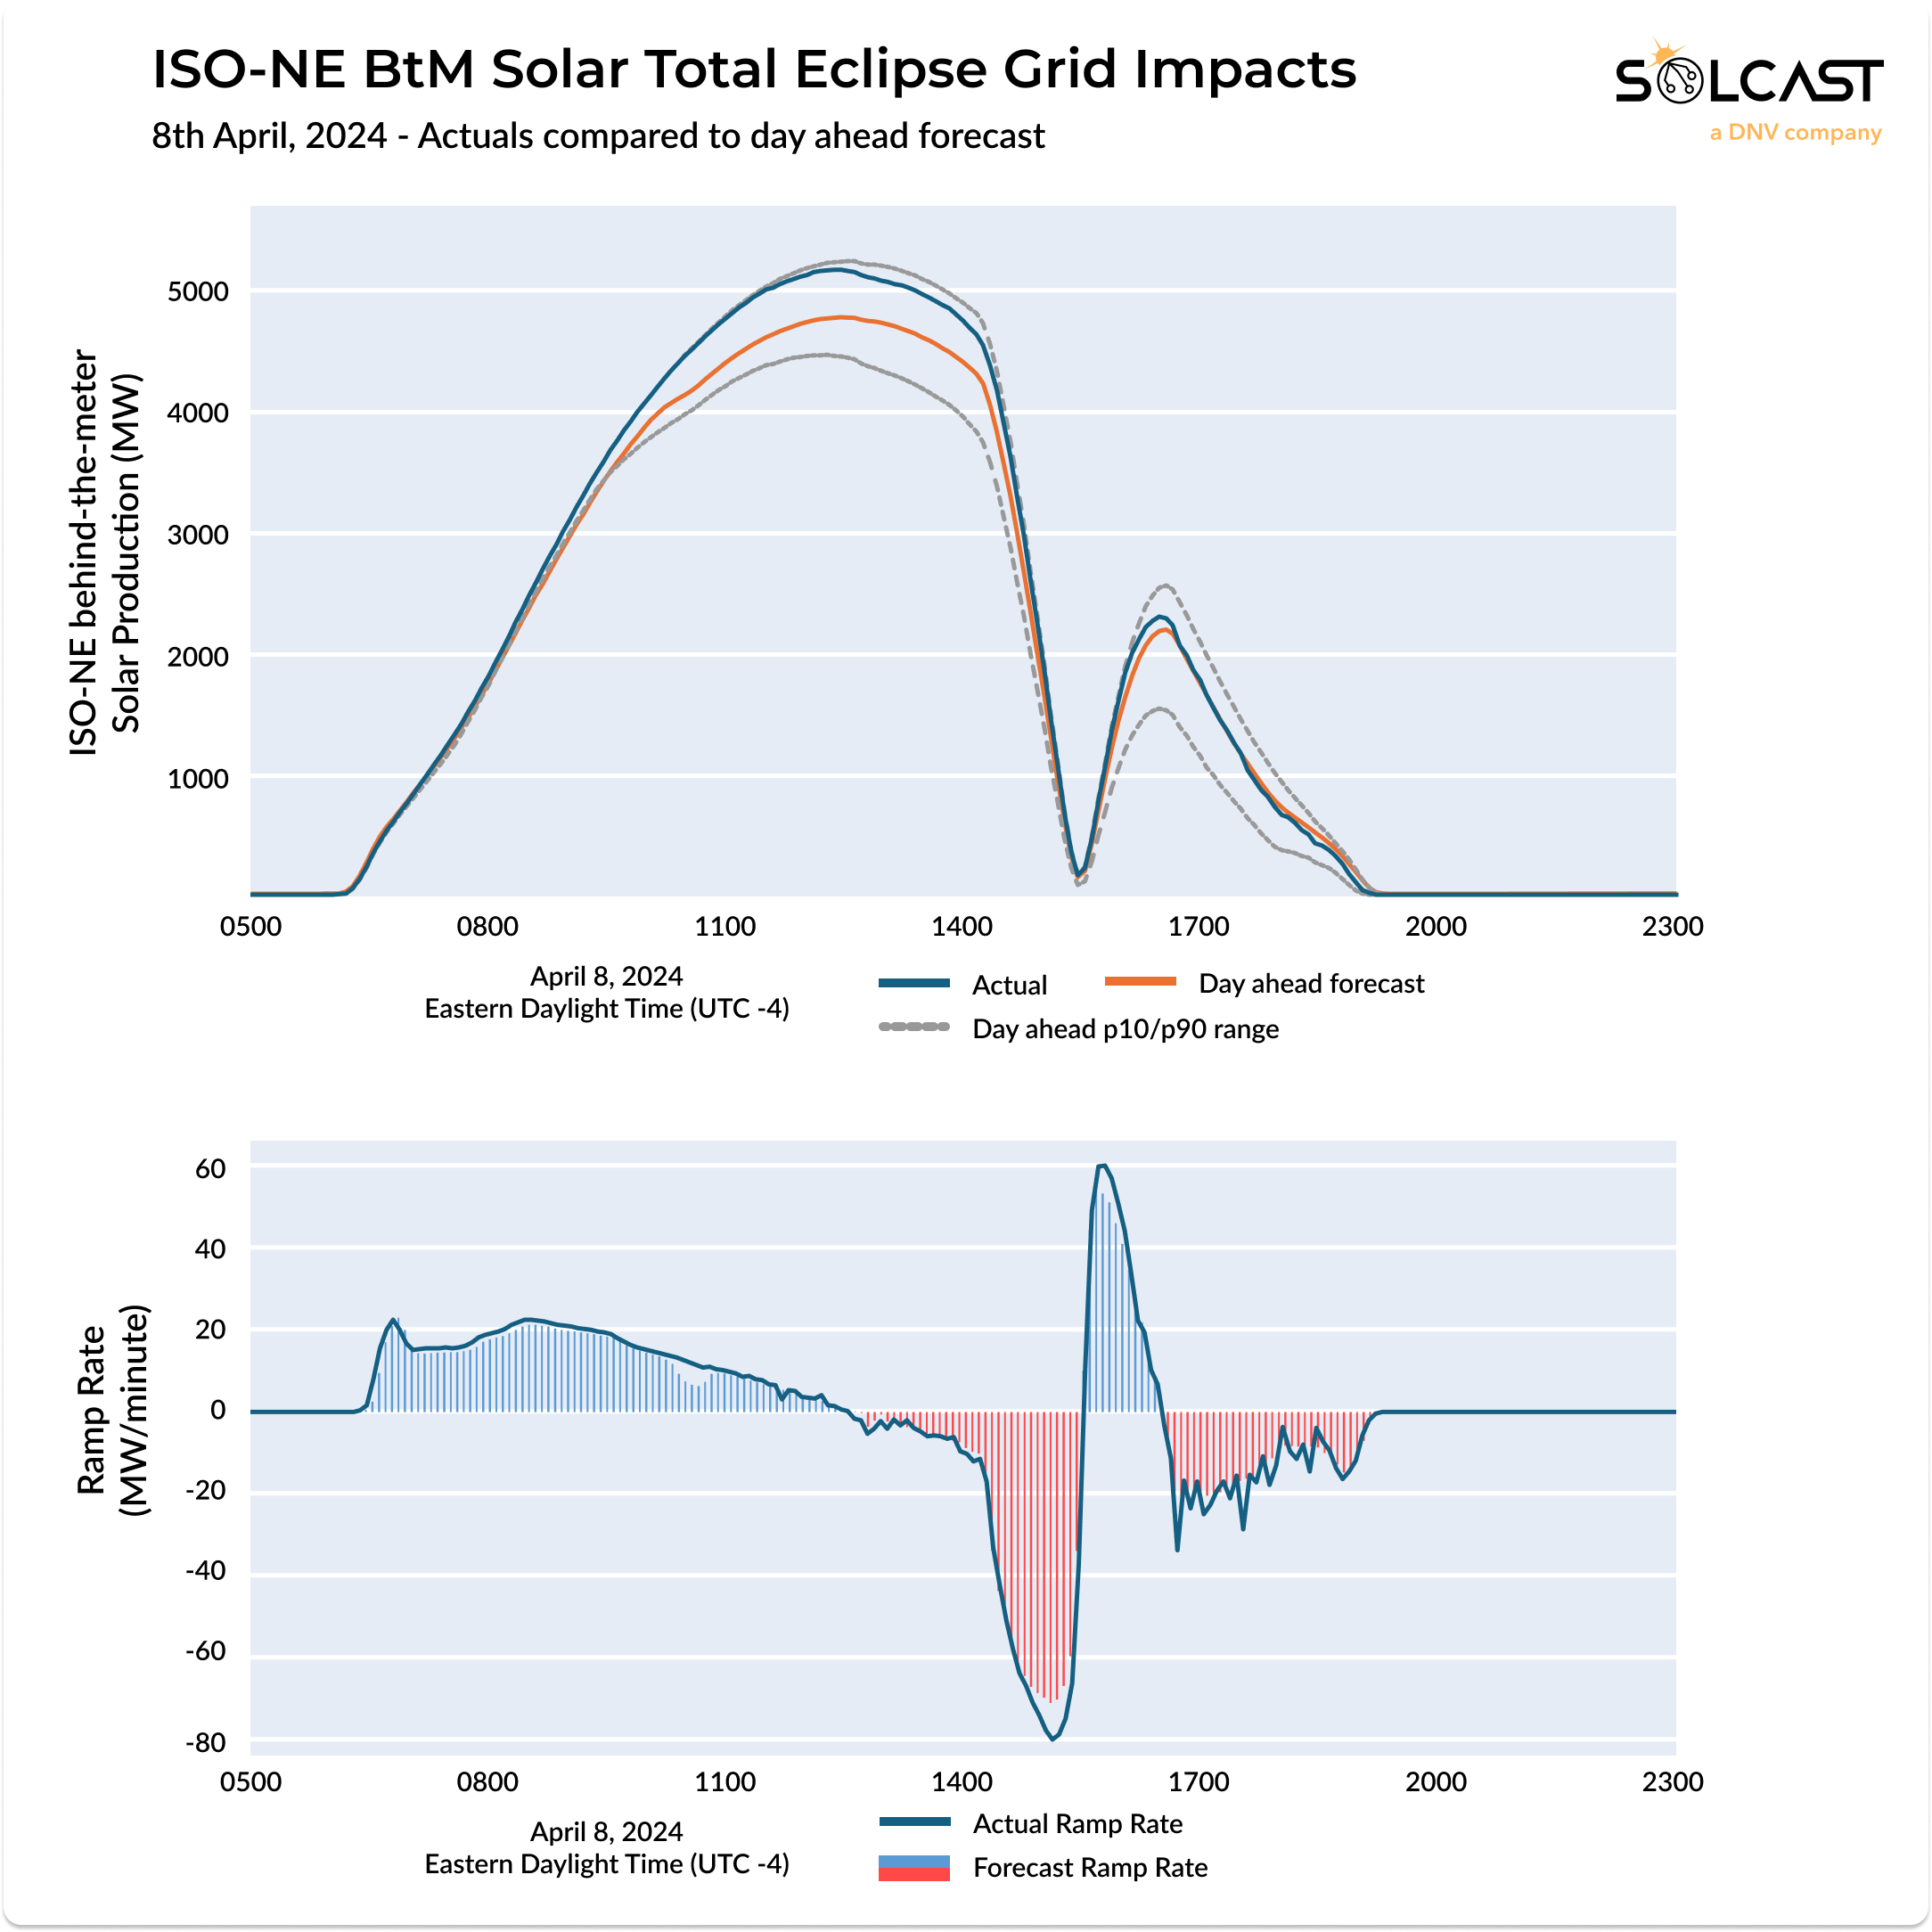
New England Grid Impacts (ISO-NE)
New England experienced less cloud than expected before the eclipse's peak, and actuals for solar were close to the p90 forecast. There was an observed ramp-up in solar output post-eclipse, with actuals slightly exceeding the day ahead forecast.
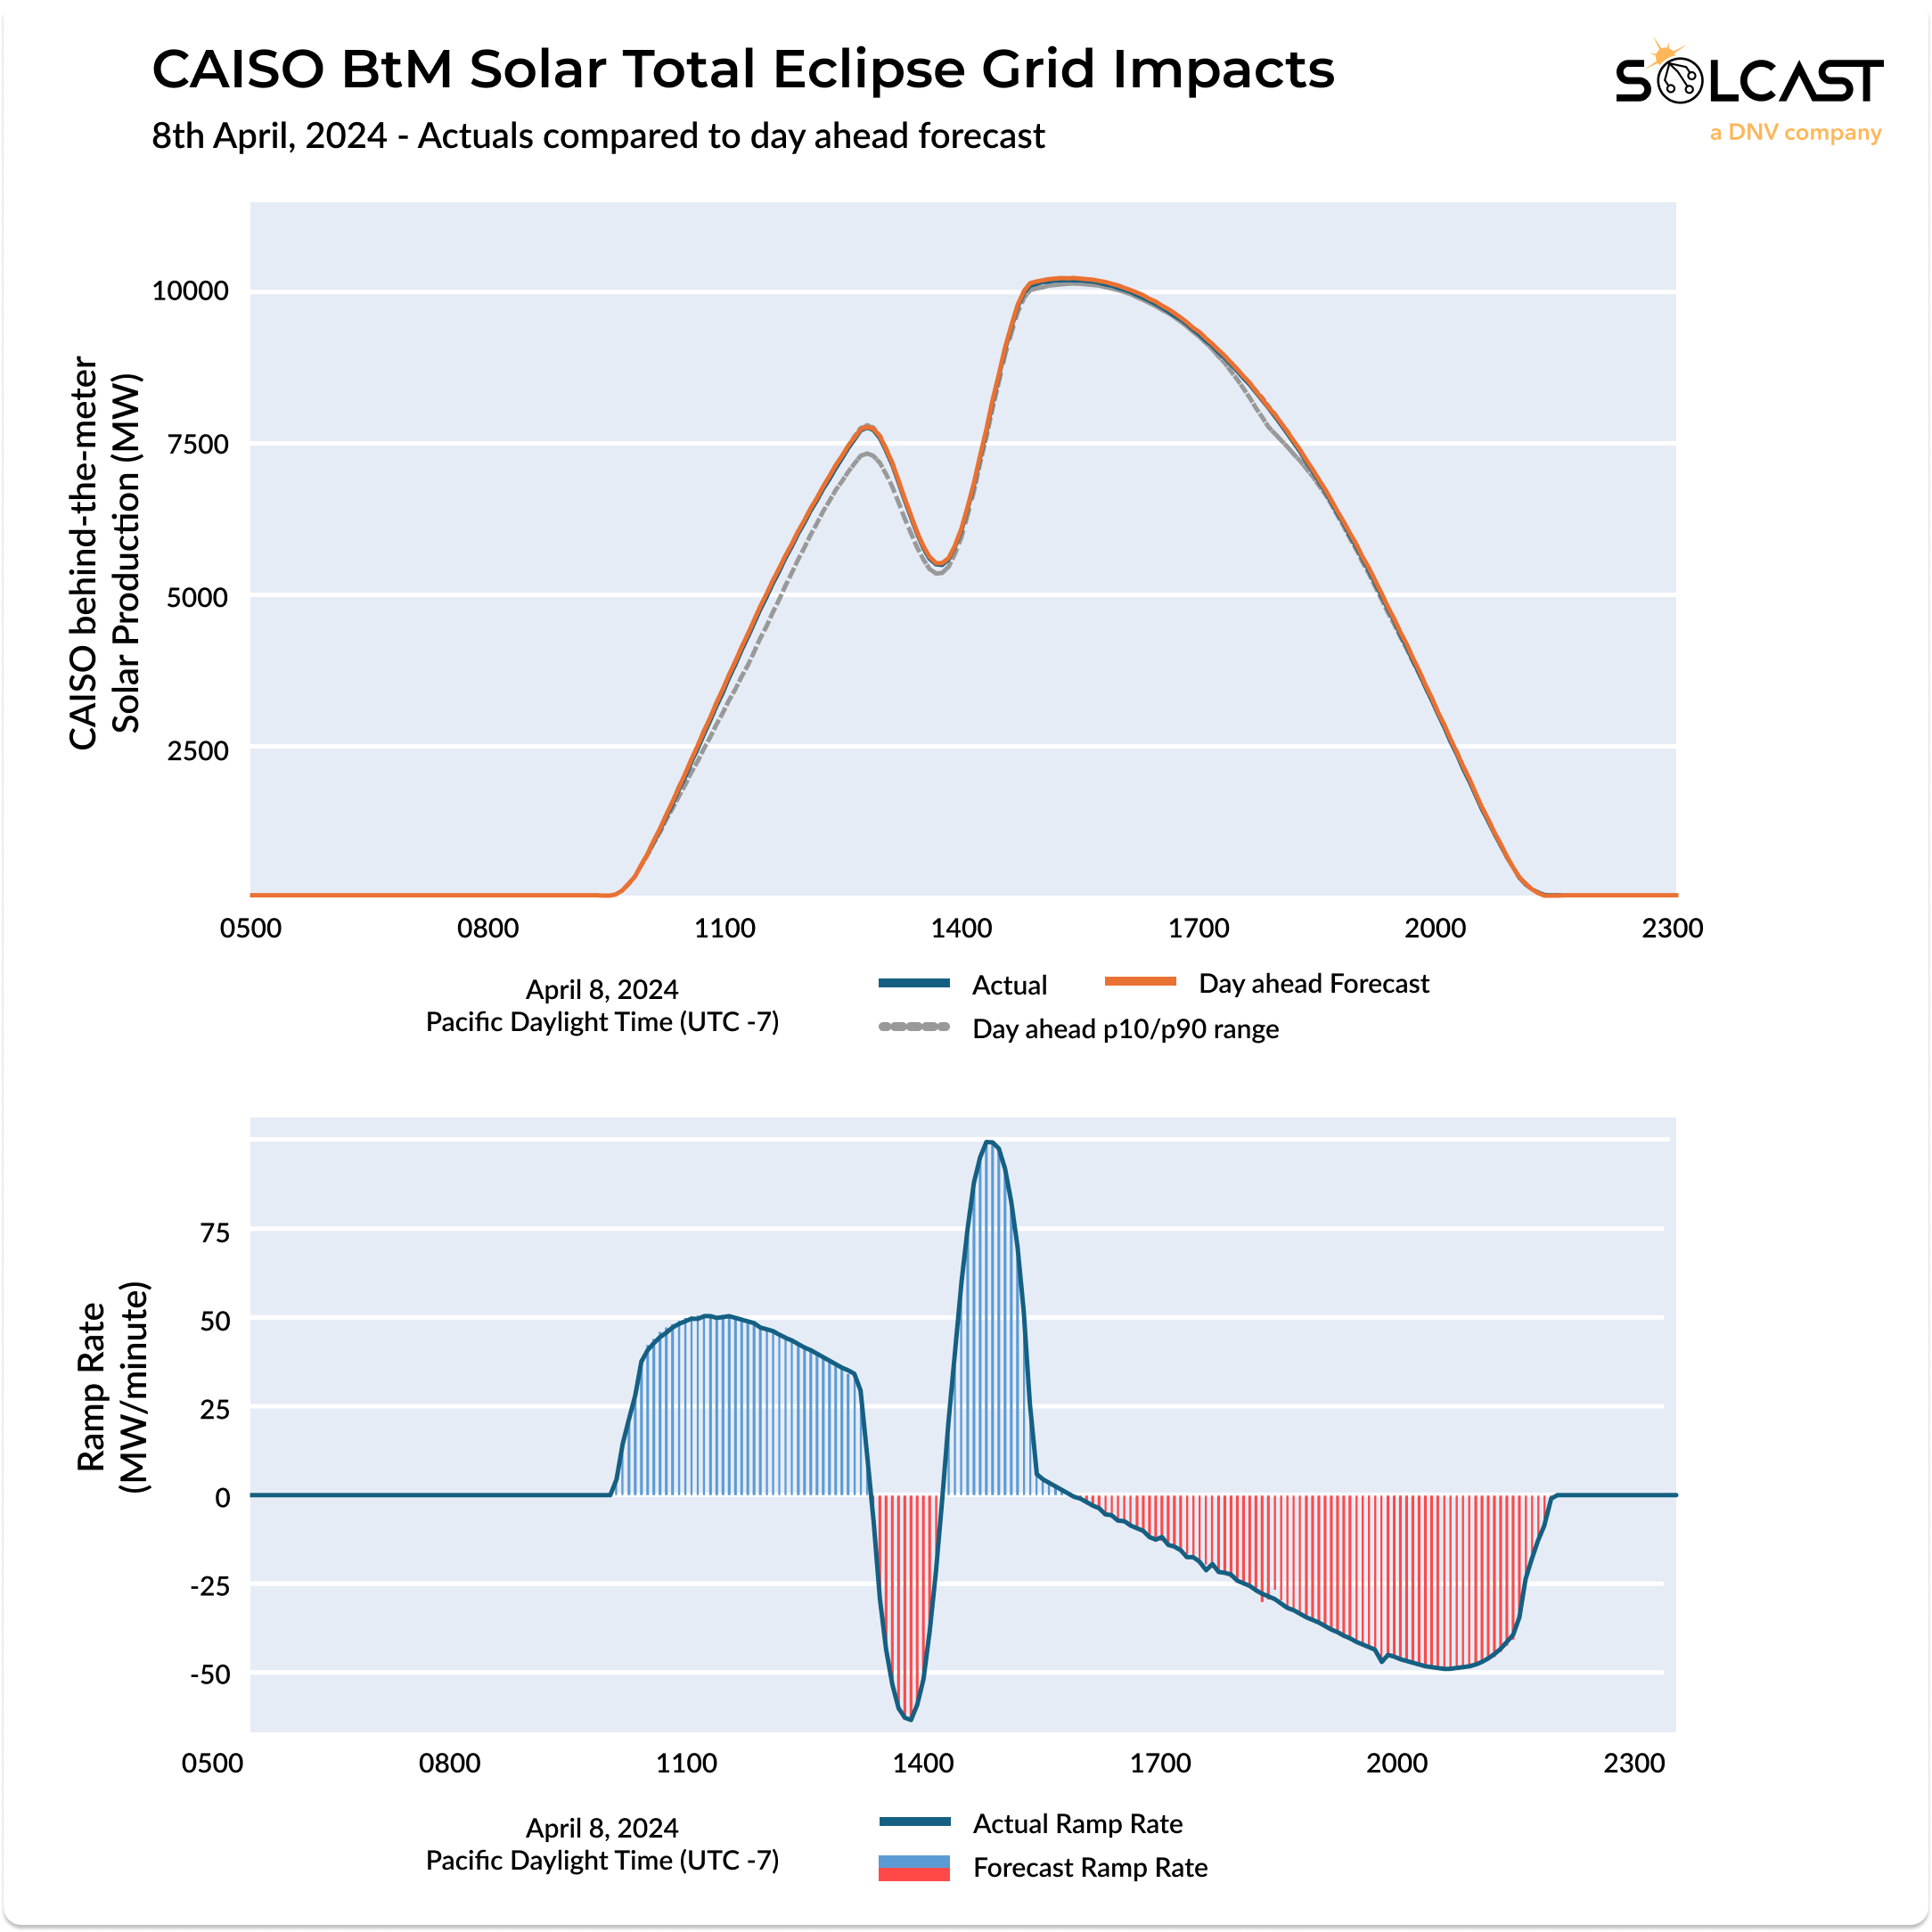
California Grid Impacts (California)
Actual California behind-the-meter solar generation overlapped with the forecast, as a very clear day is relatively easy to forecast with high confidence. As you can see above, the forecast and actual are almost exactly aligned, and the p10 range is only slightly below that (i.e. very unlikely to have even light cloud). Clear days like this beneficial to both eclipse watchers despite not being in the totality of the eclipse, and the CAISO grid. Post-eclipse, the region saw a significant uptick in solar generation, as the day was still ramping.
CAISO generation mix data shows that all of the solar shortfall was made up with batteries, without any discernible utilisation of natural gas.
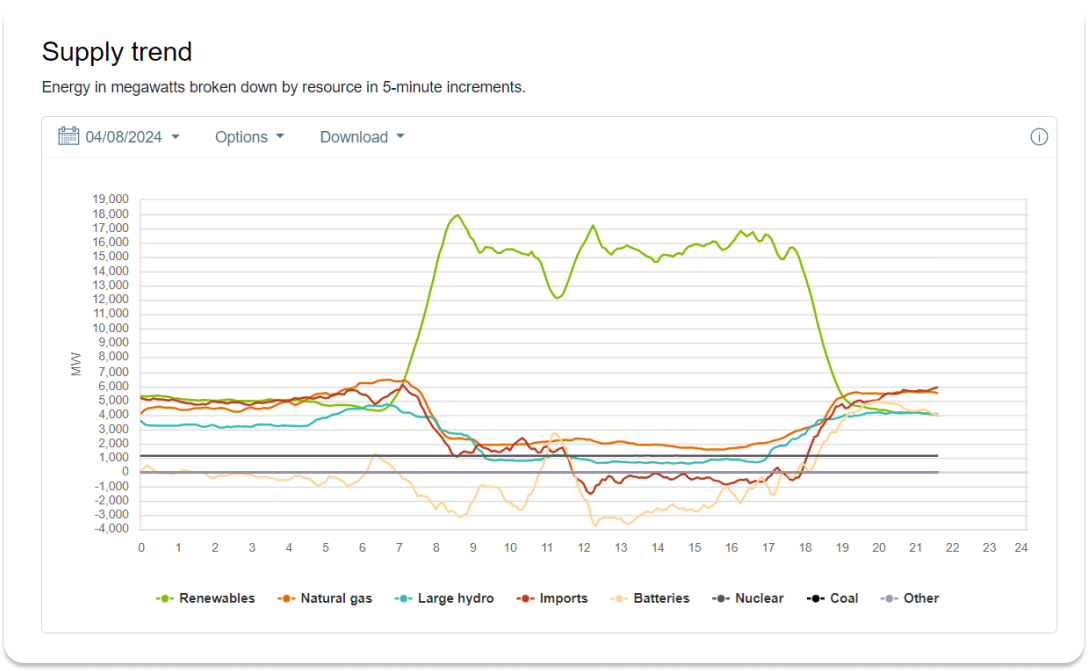 Source: CAISO

Harry Woods
Harry is our Head of Marketing, and works with our customers and industry partners to discover and share the new and innovative applications of Solcast data that are being built every day inside the Solar Industry. He holds a Bachelor of Laws and Bachelor of Arts and has experience in Go-To-Market working with complex enterprise grade technology solutions ranging from Ethical AI to Telecommunications.