


Irradiance and Weather Data
Solcast irradiance inputs and models powering globally validated solar irradiance data
.avif)
This page outlines the data inputs, models and algorithms used in the production of Solcast’s global-coverage Irradiance and Weather data, across Historic (2007 to -7 days), Live (-7 days to present moment), and Forecast (present moment to +14 days) time periods. PV power models and algorithms are outlined in separate pages. For further product and accuracy information, users may refer to other Solcast documentation, including Product Guides, Product Specifications, and Accuracy and Validation Reports. Or reach out to our team if you have questions.
Irradiance Models
This section details the models used by Solcast to produce irradiance data. The following sections of this page detail the inputs to those models. The Solcast data parameters determined using these models are Global Horizontal Irradiance (GHI), Direct Normal Irradiance (DNI), Diffuse Horizontal Irradiance (DHI), and Global Tilted Irradiance (GTI). The parameters indirectly determined using these models are Snow Soiling Loss – Rooftop, and Snow Soiling Loss – Ground Mounted (in conjunction with temperature and precipitation data). Solcast irradiance data, along with this snow soiling data, is also used to determine the PV parameters Advanced PV Power Output and Rooftop PV Power Output, please refer to PV modelling methodology documents.
OVERVIEW
The Solcast method for estimating solar irradiance from geostationary weather satellites and weather model data consists of four major modelling steps, depicted in grey boxes in the following schematic diagram. The first step (Solcast Cloud Model) is the detection and characterisation of clouds from satellite imagery.
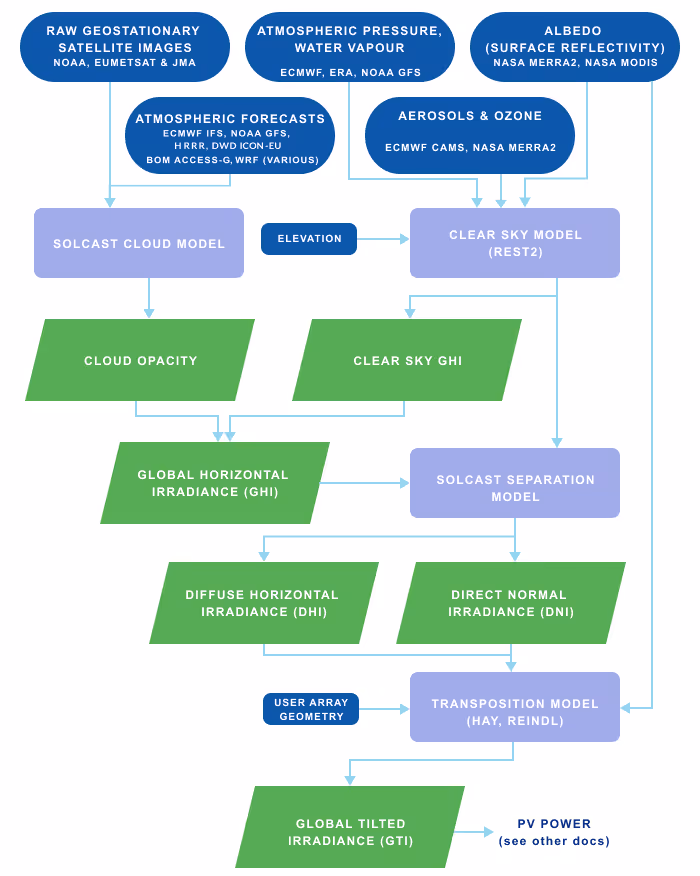
CLEAR SKY MODEL
The purpose of a clear sky model is to determine the available solar irradiance under clear skies (i.e. before clouds are considered), including the effects of aerosols (dust, salt, etc.), water vapour, air pressure, elevation and surface reflectivity (albedo).
The clear sky model used by Solcast is the REST2v5 model (Gueymard 2008), with proprietary configurations and improvements, including bias correction of numerical weather inputs. The REST2 model, which is widely used and heavily validated, breaks down solar irradiance attenuation into spectral regions, to represent the impact of aerosols (including dust, salt, smoke, pollution etc.), ozone, and water vapour.
Solcast runs REST2 using time-dynamic and location-specific inputs for aerosol, albedo, water vapour and ozone. In addition, global elevation data at 90m is used as a time-static location specific input.
If selected as an option, terrain shading is now applied. First, the 90m resolution terrain grid in a 30km radius is processed to determine the horizon profile using methods from Dozier and Frew, 1990. This horizon profile is then used to determine beam-blocking in the clear-sky direct irradiance (DNI) and sky-view factor reduction in clear-sky diffuse irradiance (DHI) using methods adapted from Zhang et.al, 2017. The clear-sky global irradiance (GHI) is updated to be consistent with the terrain-corrected components.
SOLCAST SEPARATION MODEL
A separation model, otherwise known as a diffuse model, determines the decomposition of global irradiance into its direct (beam) and diffuse components, providing values for DNI and DHI.
The Solcast Separation Model is a proprietary model based on machine learning methods, which uses a range of inputs including the REST2 output, and Solcast’s own cloud detection and tracking data.
TRANSPOSITION MODEL (HAY, REINDL)
A transposition model transposes irradiance components to plane-of-array, enabling GTI to be calculated, which is typically the final step before PV modelling.
For transposition to plane of array from diffuse and direct components, Solcast uses the Hay model (Hay & Davies, 1980) for Advanced PV Model sites, and the Reindl model (Reindl et al. 1990) model for Rooftop PV model sites.
Solcast cloud model and inputs
This section details the inputs and algorithms used within the Solcast Cloud Model, which is to produce irradiance data (and later PV power data). The Solcast cloud model is also the determinant of the data parameter Cloud Opacity, an estimate of the clouds’ optical thickness.
CLOUD MODEL INPUT DATA USAGE ACROSS HISTORIC, LIVE AND FORECAST TIME PERIODS
The Solcast Cloud Model uses two primary classes of input data: Geostationary Meteorological Satellite (GMS) data, and Numerical Weather Prediction (NWP) data. The GMS data are used for Historic (2007 to 7 days before present time) and Live (7 days before present time to the present time) data, and the first 4 hours of Forecast data. The NWP data are used for longer horizon Forecasts as far as 14 days ahead. These data inputs, their characteristics and usage are summarised in the following table.
Solcast API time period | Historic | Live | Forecast | ||
|---|---|---|---|---|---|
Cloud model data source | GMS archive | Live GMS data | Nowcast (GMS extrapolation) | Nowcast to NWP blend | Numerical Weather Prediction (NWP) |
Timespan of input data usage | 2007 to - 7 days before present time | -7 days to present time | Present time to +2 hours ahead | +2 to +4 hours ahead | +4 hours ahead to +14 days ahead |
Spatial resolution | Modelled irradiance: | Modelled irradiance: | Modelled irradiance: | Blend | Modelled irradiance: |
Time resolution | Modelled: | Modelled: | Modelled: | Blend | Modelled: |
Data sources | NOAA GOES | GOES 18 and 19 | GOES 18 and 19 Meteosat-09 and 12 (MTG) Himawari 9 | Blend | NOAA GFS |
Table 3.1
SATELLITE CLOUD DETECTION ALGORITHMS FOR HISTORIC AND LIVE DATA
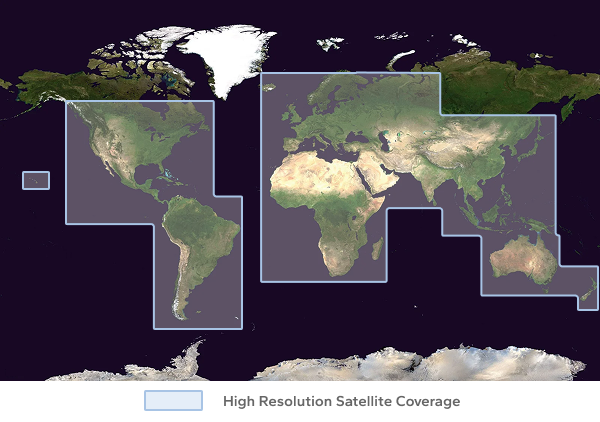
For the Historic and Live periods, the Solcast Cloud Model uses high-resolution raw imagery from a range of geostationary meteorological satellites, from which cloud properties are diagnosed using a combination of peer-reviewed, industry-standard models, and proprietary algorithms developed at Solcast from 2016 to present. As described in the above section, the core input we use for detecting clouds from space is GMS satellite imagery. The present generation of satellites from NOAA, EUMETSAT and JMA (satellites in 5 different positions) produce scans of the Earth every 5 to 15 minutes at resolutions as fine as 500m. Theses satellites provide global coverage except polar regions, and Solcast utilises this coverage over all continents and surrounding islands, except Antarctica.
In pre-processing steps, raw satellite imagery is georeferenced and projected onto a regular grid. The channels are converted to regular units. Visible channel data is converted from observed radiance to (bi-directional) reflectance, the fraction of reflected incoming radiation, which is independent of solar zenith during daytime periods. Infrared channel data is converted to brightness temperature, which is closely correlated to cloud-top temperature where there are clouds, and surface skin temperature elsewhere. Automated quality control is applied to catch imagery artefacts, such as swathes of empty data and striping, before they can corrupt downstream processing.
The standardised imagery is then converted into an uncalibrated initial estimate of cloud opacity, based on analysis of recent day imagery. The visible channel reflectance is differenced with a pre-computed estimate of the clear-sky surface reflectance (based on a synthesis of recent past satellite imagery and other surface analyses including for snow presence and depth). This estimate is then further processed using information from a combination of IR imagery and NWP forecast data to account for confounding phenomena such as sun glint over tropical oceans, snow, salt pans, and other artefacts. Data are gap-filled across periods of satellite outages or bad satellite scans, using a combination of same-day satellite data and also weather reanalyses, in a combination that depends on the duration of the gap.
Solcast purposefully avoids using or providing data for dates prior to 2007, for the following reasons
(i) the poorer quality of satellite data from earlier sensing platforms, including poor temporal and spatial resolution, poor geolocation, and more frequent artefacts;
(ii) the lack of surface measurement data from earlier periods; and
(iii) rapid global climate change, which can alter local cloud climatology, thereby offsetting the potential benefits of a longer data period for estimating interannual variability.
CLOUD TRACKING AND NOWCASTING ALGORITHMS FOR SHORT-RANGE FORECAST DATA
For the earliest part of the Forecast data period, typically 0 to 4 hours ahead, the Solcast Cloud Model spatially extrapolates the satellite cloud detections forward in time using analysis of their recent movement. This approach improves the accuracy of short-range forecasts, and allows major cloud-driven ramp events to be anticipated. This extrapolation is the sole driver of Forecast irradiance and PV power data for the first two hours, and is then blended progressively through the third and fourth hours to the NWP-driven forecast described in the following section.
The spatial extrapolation of detected cloud uses flow fields derived with the assistance of proprietary computer vision algorithms, trained on a sequence of recent satellite image data. This forecast process is updated with every new satellite scan, and operates on a probabilistic framework, which is used to generate the 10 and 90 percentile scenarios that are included in all Solcast irradiance and PV power forecast data. The probabilistic data is based on actual cloud variability and movement rather than long-term statistics, this allows for a sharper and more dynamic probabilistic forecast envelope. Our approach is particularly effective in capturing fast moving, fast changing cloud cover conditions. It is also effective in predicting cloud cover advection under weather conditions where vertical cloud layers are moving in different directions at different heights and at different speeds.
CLOUD MEDIUM RANGE FORECAST ALGORITHMS FOR LONGER HORIZON FORECAST DATA
For the remainder of the Forecast data period, i.e. from 4 hours ahead to 14 days ahead, the Solcast Cloud Model uses gridded weather model forecasts (called NWP), from the models listed in the table 3.1 above. Forecast data from these models are subjected to Machine Learning using power and weather measurements and our satellite-derived cloud measurements. Probability measures are based on the full set of NWP scenarios, calibrated for reliability using past measurements. The probability measures are output as 10th and 90th percentile probabilistic forecast bands. As part of the machine learning framework, NWP models are dynamically weighted according to their recent performance, with preference to the current best performers.
Aerosol, Albedo and Ozone data inputs
This section details the aerosol, albedo and ozone data inputs used by Solcast. These inputs are used in the production of irradiance data (and later PV power data) according to the above. The albedo inputs are also used more directly to generate the Albedo Daily data parameter, an interpolated (smoothed) value of surface reflectivity that does not capture any diurnal angular dependence of reflectivity.
DATA SOURCES FOR AEROSOL, ALBEDO AND OZONE DATA
Solcast uses several sources of global, time-dynamic, observationally-bound gridded data as inputs to produce its aerosol and albedo data. Firstly, the Modern-Era Retrospective analysis for Research and Applications Version 2 (MERRA2) atmospheric reanalysis from NASA is used for all time periods where it is available, which is for historical data up to 2 months ago. Secondly, the Copernicus Atmosphere Monitoring Service (CAMS) global analysis and forecast model from the European Centre for Medium-Range Weather Forecasts (ECMWF). Each of these sources has components that assimilate a wide range of measured satellite retrievals, and also components that propagate and evolve data forward from and between measurements. Furthermore, for historical albedo data Solcast uses Moderate Resolution Imaging Spectroradiometer (MODIS) products from NASA. Solcast performs spatial and temporal interpolation on these input data, and performs bias corrections in order to maintain consistency and minimise bias in the resulting irradiance data.
Solcast API time period | Historic | Live | Forecast |
|---|---|---|---|
Data source | NASA MERRA-2 | ECMWF CAMS | |
Timespan of input data usage | 2007 to -2 months before present time | -2 months before present time to +5 days ahead | |
Source spatial resolution | 0.5° (latitude) x 0.625° (longitude) | 0.5° (latitude) x 0.625° (longitude) | |
Source time resolution | 60 minutes (Daily for Albedo) | 60 minutes (Daily for Albedo) | |
Modelled time resolution | 5 minutes |
Other weather parameters
This section details data inputs used by Solcast in the production of the remaining weather parameters, which include the Solcast data parameters: Air Temperature, Wind Speed (10 & 100m), Wind Direction (10 & 100m), Relative Humidity, Surface Pressure, Precipitable Water, Precipitation Rate, Dewpoint Temperature, and Snow Depth Water Equivalent.
Surface Pressure and Precipitable Water are also used as inputs to the Clear Sky Model, which is used in the production of irradiance data (and later PV power data), as described above.
Air Temperature and snow depth data are also used in the production of Snow Soiling Loss – Rooftop, and Snow Soiling Loss – Ground Mounted data parameters, in conjunction with the irradiance from the models described above.
DATA SOURCES FOR OTHER WEATHER PARAMETERS
Similar to the approach taken for aerosol and albedo data, Solcast uses two sources of global, time-dynamic, gridded data as inputs to produce its other weather data. Firstly, the ECMWF reanalysis (ERA-5) atmospheric reanalysis from ECMWF is used for historic data up to ~around 7 days from real-time. Secondly, forecasts from the Global Forecast System (GFS) NWP model from NOAA are used from the end of ERA5 data to +14 days ahead of present time. Each of these sources has components that assimilate a wide range of surface observations and measured satellite retrievals, and components that propagate and evolve data forward from and between measurements. Solcast performs spatial and temporal interpolation on these data sources.
Solcast API time period | Historic | Live | Forecast |
|---|---|---|---|
Data source | ECMWF ERA-5* | NOAA GFS | |
Timespan of input data usage | 2007 to around 7 days ago | Around 7 days ago to +14 days ahead | |
Spatial resolution | Source data: 0.25° x 0.25° | Source data: 0.25° x 0.25° | |
Time resolution | Modelled: 5 minutes | Modelled: 5 minutes |
*ECMWF released ERA5 in two stages: ERA5T first, followed by the validated ERA5 a few months later. Solcast updates its data with the validated ERA5 as soon as it becomes available.
Typical Meteorological Year (TMY) Methodology
Solcast generates Typical Meteorological Year (TMY) data from the historical data reviewed in the 2024 DNV Bankability report. To produce a typical year, data is selected from the Solcast historical record for each month of the year that has the lowest deviation from a target statistic. The target summary statistic is a weighted average of DNI and GHI long term time series mean. The user can control the weighting of the DNI versus the GHI statistic. This facilitates the creation of a Typical DNI Year (TDY) using a 100% DNI weight, a Typical GHI Year (TGY) using 100% GHI weight, or some value in between. By default, weights of 80% DNI and 20% GHI are used.
The TMY irradiance data is then rescaled, for each month, such that there is zero monthly mean bias deviation with respect to the multiyear time series monthly averages for components of irradiance. As a result of the rescaling, the mean bias error for GHI and DNI presented in this study of the historical time series data will match those of Solcast TMYs.
In the creation of Pxx scenarios of the TMY, annual long-term target summary statistics are adjusted by an uncertainty measure to derive the annual Pxx target value. The uncertainty measure combines uncertainty of interannual variability and the uncertainty of the irradiance model. The uncertainty of interannual variability is calculated with the assumption that the distribution of yearly values is normally distributed. Irradiance model uncertainty is derived from a global comparison with ground measurements of GHI and DNI, similar in methodology to the validation included in this study. To construct the TMY, months are iteratively selected to minimize the difference between the annual Pxx target.
References
Dozier, J., Frew, J., 1990. Rapid calculation of terrain parameters for radiation modeling from digital elevation data. IEEE Transactions on Geoscience and Remote Sensing, 28(5).
Hay, J.E., Davies, J.A., 1980. Calculations of the solar radiation incident on an inclined surface. Proc. of First Canadian Solar Radiation Data Workshop, 1980, 59. Ministry of Supply and Services, Canada.
Gueymard, C.A., 2008. REST2: High-performance solar radiation model for cloudless-sky irradiance, illuminance, and photosynthetically active radiation–Validation with a benchmark dataset. Solar Energy, 82(3), pp.272-285.
Reindl, D. T., Beckman, W. A., Duffie, J. A., Diffuse Fraction Corrections, Solar Energy, 45(1), pp. 1-7, 1990.
Zhang, Y., Chang, X., & Liang, J. 2017. Comparison of different algorithms for calculating the shading effects of topography on solar irradiance in a mountainous area. Environmental Earth Sciences, 76(7).
Commonly Asked Questions about Solcast's Irradiance Methodology
How is satellite data used in solar irradiance measurement?
Satellite data is used to estimate solar irradiance by capturing images of the Earth's surface and atmosphere. Solcast uses high-quality model inputs, advanced algorithms, and model upgrades to convert these images into high-resolution irradiance data built for solar applications. By using satellite data, Solcast is able to provide irradiance data for locations that do not have sensors, or for a time period when a sensor was not available.
What are the common challenges in measuring solar irradiance?
Common challenges in measuring solar irradiance include cloud cover, dust and aerosols, terrain, snow, and other factors. Solcast considers over 30 weather parameters, including those that influence irradiance, and can lead to variations in the diffuse and direct components. Key parameters like Direct Normal Irradiance (DNI), Diffuse Horizontal Irradiance (DHI), and Global Horizontal Irradiance (GHI) are also used for accurate measurement.
What are reliable data inputs or sources for solar energy?
Solcast meticulously select high-quality data input for its model algorithms. Modern advanced satellite imagery, comprehensive weather data from ECMWF and ERA-5, and albedo and aerosols data from sources like MERRA2, CAMS, MODIS are used. Bias corrections are applied using AERONET measurements. The rise of meso-scale weather models is also carefully monitored, and recently Solcast recently integrated HRRR and ICON-EU inputs into its models to enhance forecast accuracy in North America and Europe, respectively.