


Advanced
PV Power Forecast Model
PV modelling methodology and specifications of Solcast's Advanced PV Model
Introduction
This page outlines the PV modelling methodology and specifications of Solcast's Advanced PV Model, through which users can access forecasts and modelled actuals with global-coverage across Live (-7 days to present moment), and Forecast (present moment to +14 days) time periods.
1. Model overview
The Solcast Advanced PV Model, which produces the data parameter Advanced PV Power Output (MW) is designed for PV plants where system specifications are known, and where accuracy of production estimates and forecasts are important. Solcast's Advanced PV model is based on the open source pvlib-python library, with several proprietary extensions added by the Solcast team.
To use the Advanced PV model, a user must first create their site(s) in the Solcast system, either manually via the Solcast API Toolkit web portal or programmatically via the Solcast API. These sites exist to store, list, and edit the PV plant specifications used by the model, and site location information. There is no delay between site creation and availability of data, due to Solcast's real-time global 1-2km resolution data capability. Each site is identified with a unique site resource ID.
The model's output data parameter Advanced PV Power Output (MW) (Solcast API parameter pv_power_advanced) is returned by the Solcast API when a user request to the API is made with the site's resource ID. These PV power values represent Solcast's irradiance and weather inputs (including satellite cloud tracking and forecasting), and the user-specified PV plant specifications. In the case of forecasts, which span from the present time up to 14 days ahead, probabilistic 10th and 90th percentile values are also returned by the API as pv_power_advanced10 and pv_power_advanced90.
2. Subscription and inclusions
The Advanced PV Power Forecast Model is one of the solar power models available from Solcast, along with the Rooftop PV Power Forecast Model and the Premium PV Power Forecast Model. The Advanced PV Power Forecast Model is recommended for larger solar assets (Utility and/or C&I) at scale or where cost management is important, and cases where your team are experts in photovoltaics and/or data science with spare time available to configure and optimise asset specification. Solcast will provide access to the Advanced PV Model via the Solcast API programmatically and also via the Solcast API Toolkit web interface, and the customer is responsible for all setup and management of PV plants in the Advanced PV model. Advanced PV is a self-service product — you configure and maintain the model.
3. Input data and model chain
The following flowchart diagram summarizes the input data and model chain used in Solcast's Advanced PV model. Dark blue boxes represent inputs (plant specifications metadata; and time-dynamic weather data inputs), blue boxes represent key steps in the model chain, and the final box represents the model output (i.e. the Solcast data parameter Advanced PV Power Output (MW).
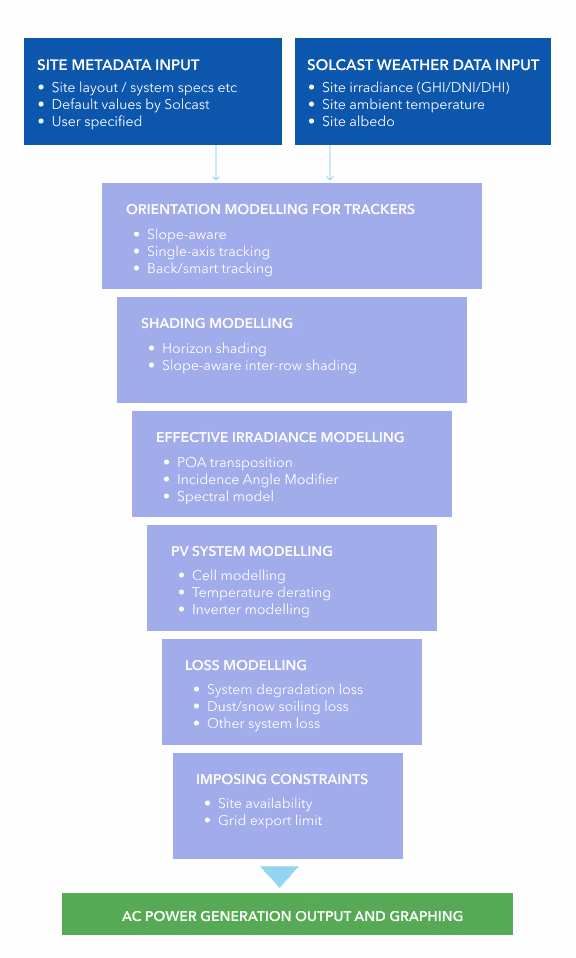
The Advanced PV model uses Solcast's irradiance and weather data as its time-dynamic input. The Solcast data parameters used by the model include irradiance parameters Direct Normal Irradiance (DNI) and Diffuse Horizontal Irradiance (DHI), ambient parameters Air Temperature and Wind Speed (10m), satellite-derived surface reflectivity parameter Albedo Daily, and a dynamic site-specific Snow Soiling Loss – Ground Mounted based on irradiance, temperature and precipitation. Additionally, PM2.5 and PM10 particulate matter concentration data is available via the API to support data-driven soiling loss analysis and modelling.
For more information about this input data, please refer to Solcast Irradiance and Weather Data Inputs and Algorithms documentation.
The model uses user-configurable plant specifications to generate a site-specific physical power simulation. Plant specifications utilised by the model include array geometry and tracking type, module and inverter information, horizon shading, dust soiling losses, other losses including degradation, presence of tracking algorithms, and bi-facial module support. A full list of the plant specifications used by the model is provided in Section 4 of this document. The model can run on a simplified set of basic plant specifications in cases where full specifications are not known. The minimum set of specifications required include location, AC capacity, and tracking type. In these circumstances, Solcast makes reasonable estimates of the remaining parameters based on the entered values. However, in general users should be aware that the input of more metadata parameters will increase both the accuracy and precision of the physical power simulation. If detailed specifications cannot be found, the model can run on a simplified set of parameters with reasonable defaults. For users who want the model to learn directly from their site's actual production data, Premium PV Power provides a managed approach — our experts train and maintain the power model using your historical generation data, with no need to configure or tune plant specifications manually.
The model chain is based on the open source software package pvlib-python, with a number of proprietary extensions built and maintained by the Solcast team. For more information on pvlib-python, see the pvlib python documentation.
4. Improving forecast accuracy using historical production data
The Solcast Advanced PV Model is primarily designed for accurate forecasting of power output and energy production for minutes to weeks ahead. The 20+ physical PV plant specifications used by the model are primarily a means of achieving this forecast accuracy. Where a long history (at least three weeks) of production measurement data of sufficient quality is available, the initially-entered and estimated/default values of these PV plant specification parameters can be reviewed and refined empirically with the objective of minimising forecast error. Read a detailed guide on how to use site measurements in Solcast's Advanced PV power model to enhance solar forecast accuracy.
5. Appendix of PV plant specification parameters
The PV plant specification parameters of the Solcast Advanced PV Model are listed in the following set of tables. For most parameters (all except those denoted with “Required field”), Solcast will pre-fill these plant specification parameters with default values based on the above basic specification parameters. However, accepting the defaults could still lead to large errors, so you are encouraged to review these assumptions and replace them with actual plant specifications. You will be able to edit these settings later.
Basic plant parameters | ||
|---|---|---|
Name | Definition | How we use this |
Name | The user-defined name of the site. | Used to display a name for your site. Can be changed. |
Latitude | Site latitude (centre of site) in decimal degrees (EPSG:4326). | Used to locate your site. |
Longitude | Site longitude (centre of site) in decimal degrees (EPSG:4326). | Used to locate your site. |
Tracking type | The type of sun-tracking or geometrical configuration of your site's modules | Used to calculate the incident irradiance for your modules |
Install date | The date when your site was installed | Used to derate your module (DC) production gradually with age, at a rate dependent on your Module Type |
AC capacity (inverters) | Total inverter (nameplate) capacity in MW. This is the highest potential output of the system before any Site Export Limit is applied | Used to model the conversion of DC power to AC by your inverters |
DC capacity (modules) | Total module capacity in MW. Usually slightly higher than the AC capacity. | Used to model the generation of DC power by your modules |
Grid export limit | The maximum power export limit in MW that is allowed by the site's connection with the network operator | Used to place a final cap on your AC power output. Only impacts your AC power if the grid export limit is set lower than the AC capacity |
Module and inverter parameters | ||
|---|---|---|
Name | Definition | How we use this |
Other losses derating coefficient | The factor by which the whole system will be derated due to causes other than temperature and degradation. | Used to display a name for your site. Can be changed. |
Age degradation derating coefficient | The factor by which the whole system will be derated per year since the Install Date. | Used to calculate time dependent system loss. |
Peak inverter efficiency | The peak efficiency value in your inverter efficiency curve. | Used to scale the conversion efficiency of DC to AC, as a function of the inverter load. |
Module temperature derating coefficient | The factor by which your site's module (DC) production will be derated with increasing temperature. | Used to derate your module (DC) production gradually with increasing temperature. |
Ground coverage ratio | The proportion of the site's ground area covered by modules. | Used to calculate the incident irradiance for your modules. |
Module type | The type of material or technology used in your site's PV modules. | Used to estimate your module temperature derating coefficient (unless you specify your own coefficient) and used to estimate your module age derating. |
Geometry parameters for fixed tilt sites | ||
|---|---|---|
Name | Definition | How we use this |
Module azimuth angle | The off-north-facing direction on the horizon in which the modules are facing for a fixed-tilt site. | Used to calculate the incident irradiance for your modules. |
Module tilt angle | The off-horizontal tilt angle of modules for a fixed-tilt site. | Used to calculate the incident irradiance for your modules. |
Geometry parameters for horizontal single axis tracking sites | ||
|---|---|---|
Name | Definition | How we use this |
Tracker smart tracking | Whether the trackers move to horizontal during cloudy periods with zero DNI, for a horizontal single axis tracking site. | Used to calculate the incident irradiance for your modules. |
Tracker back-tracking | Whether the trackers backtrack at low solar elevation angles, for a horizontal single axis tracking site. | Used to calculate the incident irradiance for your modules. |
Tracker maximum rotation angle | The maximum off-horizontal angle for a horizontal single axis tracking site. | Used to calculate the incident irradiance for your modules. |
Tracker axis azimuth angle | The off north-south azimuth angle for a horizontal single axis tracking site. Most commonly this will be close to zero. | Used to calculate the incident irradiance for your modules. |
Site terrain and dust soiling parameters | ||
|---|---|---|
Name | Definition | How we use this |
Topographic horizon elevation | The elevation angle of topography (e.g. hills and mountains) surrounding the general area of your site, at a set of specified different azimuth (direction) angles. | Used to calculate the incident irradiance for your modules. |
Average dust soiling losses | The average proportion of module production lost due to dust soiling, from 0 to 1. E.g. 0.02 for April means a 2% soiling loss will be applied throughout April. The value entered should reflect the impact of cleaning activity at your site. | Used to calculate the module (DC) production We accept either a single yearly average value, or a set of 12 monthly average values. |
Average terrain azimuth | The average terrain slope downhill direction. | Used to calculate the incident irradiance for your modules.Used to calculate the incident irradiance for your modules. Terrain Azimuth is meaningful only when terrain_slope>0. |
Average terrain slope | The average terrain slope in degrees of your site. A site with no terrain slope has a value of zero. | Used to calculate the incident irradiance for your modules. |
6. Appendix of "apply" plant condition parameters
These optional parameters exist to accommodate deviations in the actual operating condition of the plant, which can vary from minute-to-minute or day-to-day and therefore are not suitable to be semi-permanent plant specification metadata like the parameters above. When these parameters are not used, the above plant specification metadata is used. The "apply" parameters can be optionally specified in the API request, with no delay in receiving forecasts back from the Solcast API. Not all "apply" parameters need to be provided in the request, only the parameters relating to the actual changes in plant operating conditions.
Apply parameters | ||
|---|---|---|
Name | Definition | How we use this |
apply_tracker_inactive | Indicating if trackers are inactive. If True, panels are assumed all facing up (i.e. zero rotation). Only has effect if your site has a tracking_type that is not "fixed". | Used to calculate the module (DC) production |
apply_snow_soiling | A user-override for Solcast's dynamic snow soiling, which is based on global snow cover and weather forecast data, and changes from hour-to-hour. If you specify this parameter in your API call (e.g. if snow clearing has just been performed), we will replace the Solcast dynamic hour-to-hour value with the single value that you specify. E.g. if you specify a 0.7 snow soiling, your returned power will be reduced by 70%. | Used to calculate the module (DC) production. |
apply_dust_soiling | A user-override for dust_soiling_average. If you specify this parameter in your API call, we will replace the annual or monthly average dust soiling values for the site with the value you specify in your API call. E.g. if you specify a 0.7 dust soiling, your returned power will be reduced by 70%. | Used to calculate the module (DC) production. |
apply_constraint | Constraint on site's total AC production, applied as a cap in the same way as the metadata parameter Site Export Limit. This will constrain all Solcast power values to be no higher than the apply_constraint value you specify. If you need an unconstrained forecast, you should not use this parameter. | To adjust the pv power value returned by the Solcast API. |
apply_availability | Proportion of the site's total AC (inverter) capacity that is currently generating or expected to be generating during the forecast request period. E.g. if you specify a 30% availability, your returned power will be a maximum of 30% of AC capacity. | To adjust the pv power value returned by the Solcast API. |
Try the Solcast API
Solcast takes on the many challenges of producing live and forecast solar data, so that you don’t have to. That means making the data easy to access, validate and integrate. We provide instant access to live and forecast data products via this web interface, which is free to try. These include direct estimates of global, direct and diffuse solar radiation, as well as PV power output.
Commonly Asked Questions about Advanced PV Power Model
How to develop a PV model?
Developing a PV model involves gathering detailed specifications of the PV system and weather data. This data is used to create a simulation using tools like pvlib and validating the model by comparing its output with historical production data. Continuous validation and refinement of the model based on performance feedback are essential to maintain reliable solar power output predictions.
How does weather affect PV forecast accuracy?
Weather significantly impacts PV production, so PV forecast accuracy is a function of both weather forecast accuracy and the PV power model you are using. An accurate, high resolution irradiance and weather forecast (including cloud opacity, temperature, and atmospheric conditions) requires a good PV power model to produce an accurate PV power forecast. The Solcast API takes these factors into account to deliver high-resolution weather and solar forecasts required for precise PV performance predictions.
How do site measurements enhance solar power forecast accuracy?
Site measurements, such as power output data, enhance forecast accuracy by enabling empirical improvements to the PV power model. This data allows the model to be fine-tuned, reducing errors and aligning predictions more closely with real weather and solar conditions.
How to evaluate the accuracy of PV power data?
When assessing the accuracy of a given model, it’s important to consider that both the input data (i.e. irradiance parameters) and the power model are sources of bias and error. To learn how you can minimise accuracy gaps, check out the step-by-step guide on how to run your own assessment and assess quality or you can check for a guided evaluation with the team.