


Dr. Hugh Cutcher
June 25, 2024
Share this post
With signs of a possible switch to La Niña conditions, solar asset and grid operators will be looking to understand the impact this change could have on US solar production. Based on currently available data, the Atlantic hurricane season is expected to intensify to look more like a La Niña year, leading to more frequent hurricanes. La Niña years typically result in below-average solar irradiance in the Gulf of Mexico, while increasing solar irradiance along the Atlantic Coast of the USA.
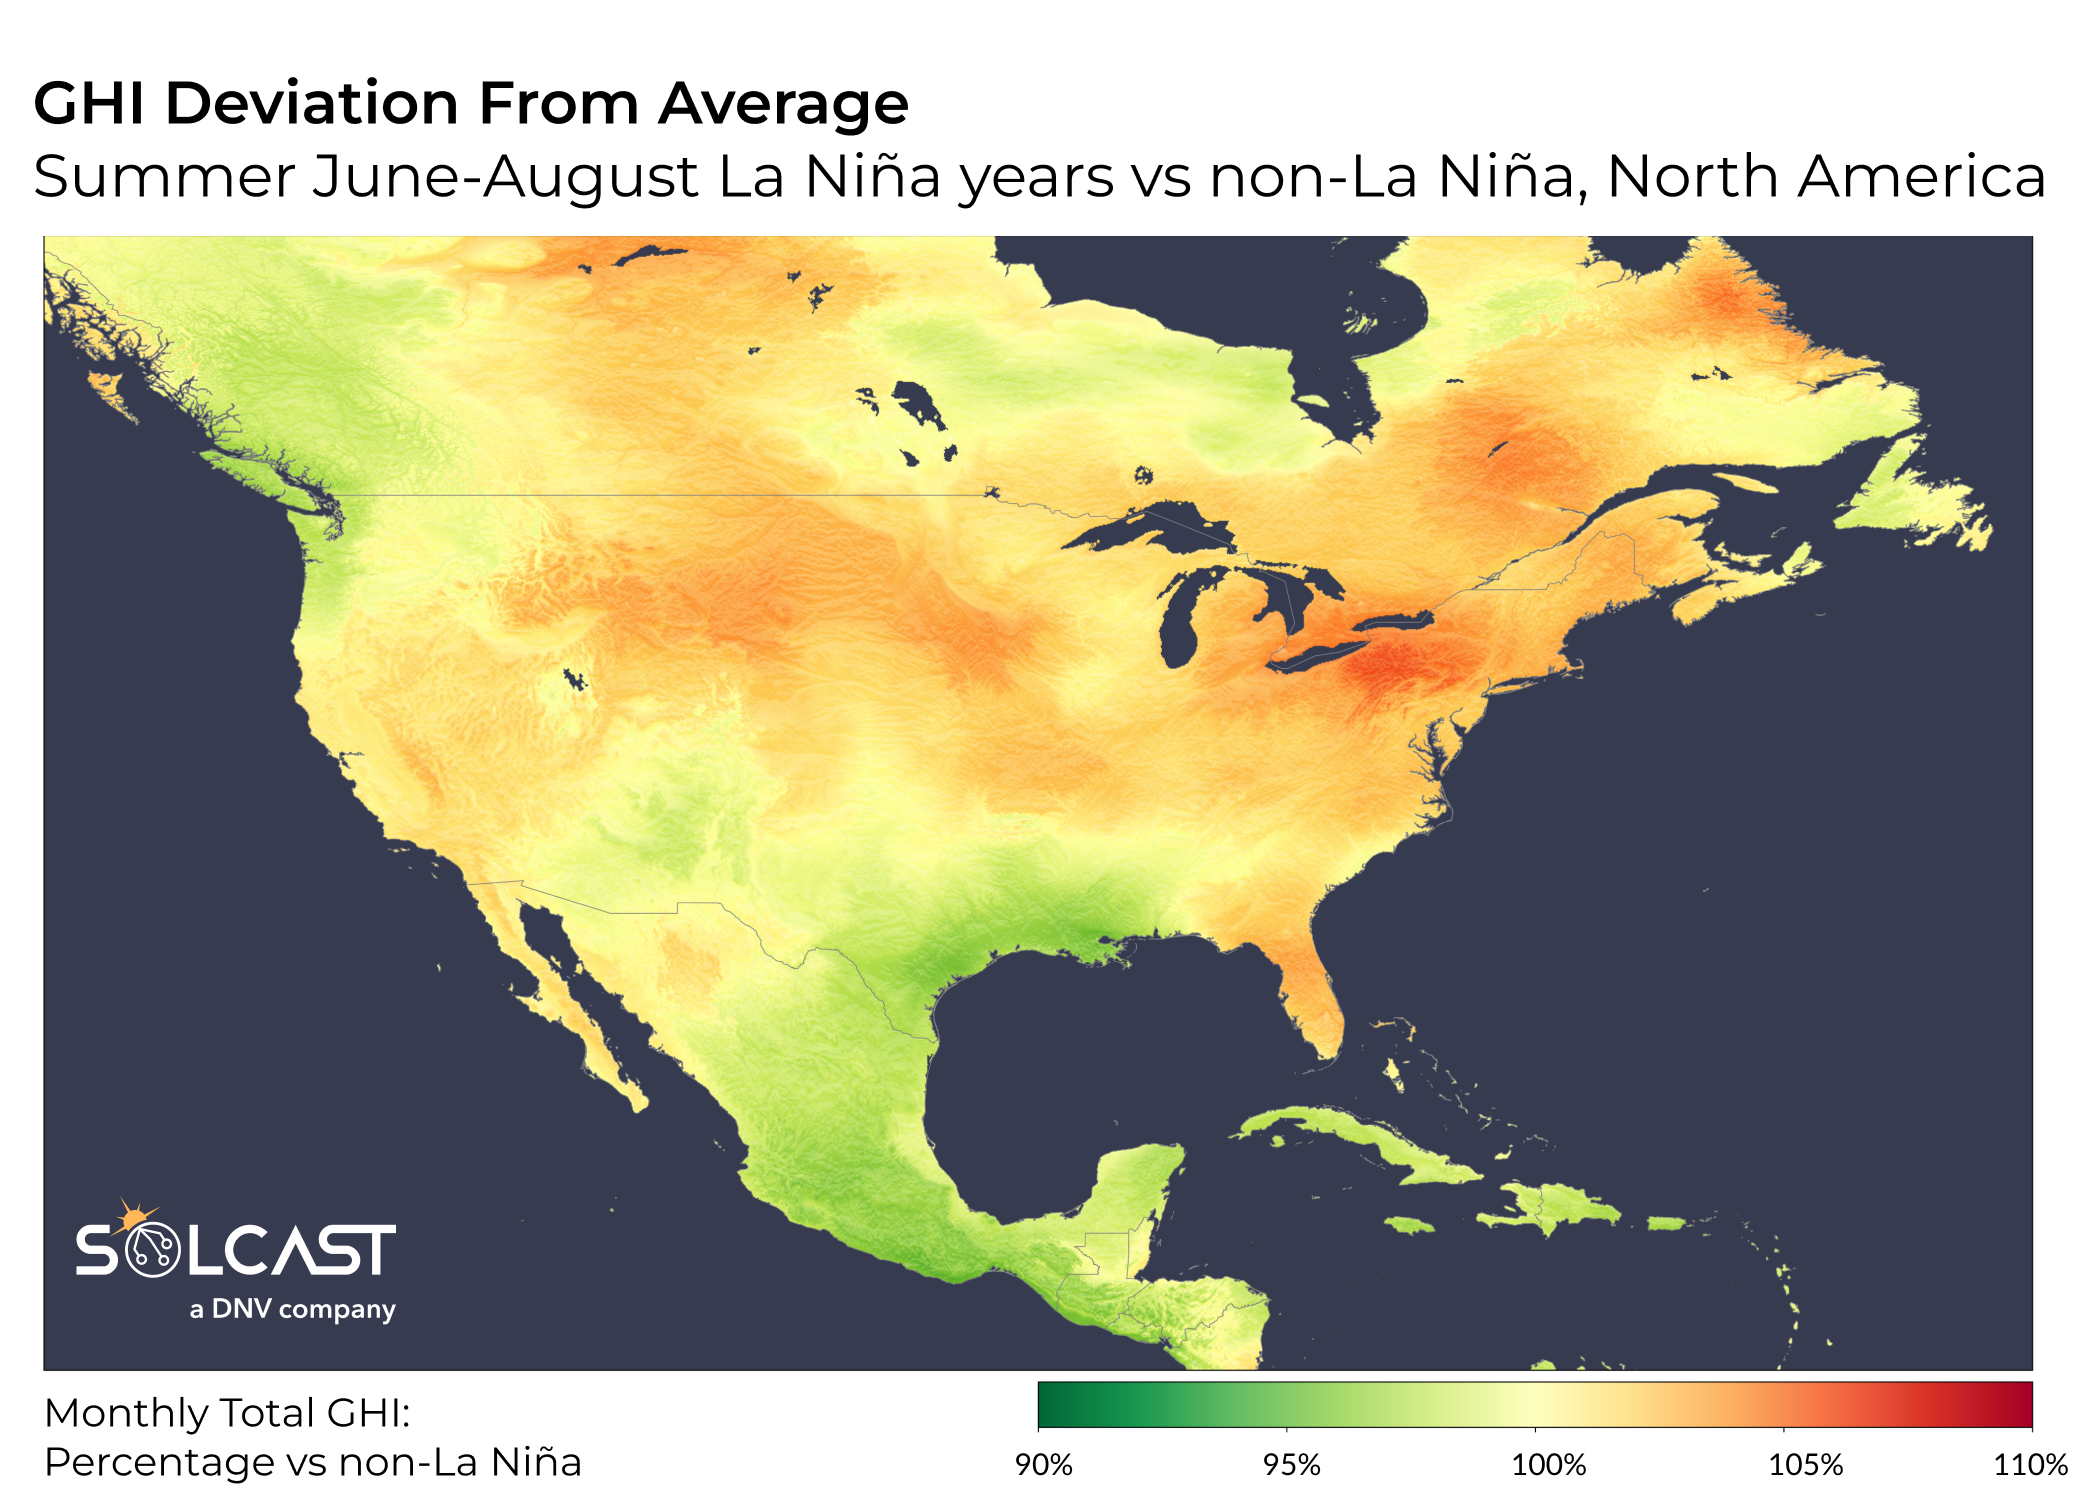
In La Niña years, the Gulf of Mexico historically sees irradiance levels up to 10% below the long-term average due to increased storm activity. La Niña, characterised by cooler sea surface temperatures in the equatorial Pacific, impacts the Atlantic hurricane season on the other side of the continental USA by shifting weather patterns. The cooler temperatures in the Pacific shift the jet stream further north, reducing vertical wind shear in the Atlantic. Normally, higher wind shear suppresses hurricane formation by disrupting their vertical structure. However, with reduced wind shear, more hurricanes can form and develop more intensely. These conditions lead to more hurricanes, convection and cloudiness in the Gulf of Mexico, resulting in decreased solar irradiance. Whether or not we actually see a shift to La Niña in 2024, these patterns are already forming, indicating a likely reduction in summer irradiance for the gulf coast.
In contrast, the Atlantic coast of the USA has historically seen up to 5-10% above-average irradiance during summer months in previous La Niña events. Despite the higher number of hurricanes that can transition into mid-latitude cyclonic storms along the East Coast, the periods between these storms experience relative stability. In between these large storms, the reduced cloud convection and rainfall lead to longer periods of clear skies. These calm periods outweigh the impacts of increased hurricane activity, leading to higher average overall solar irradiance along the East Coast for summers impacted by this weather pattern.
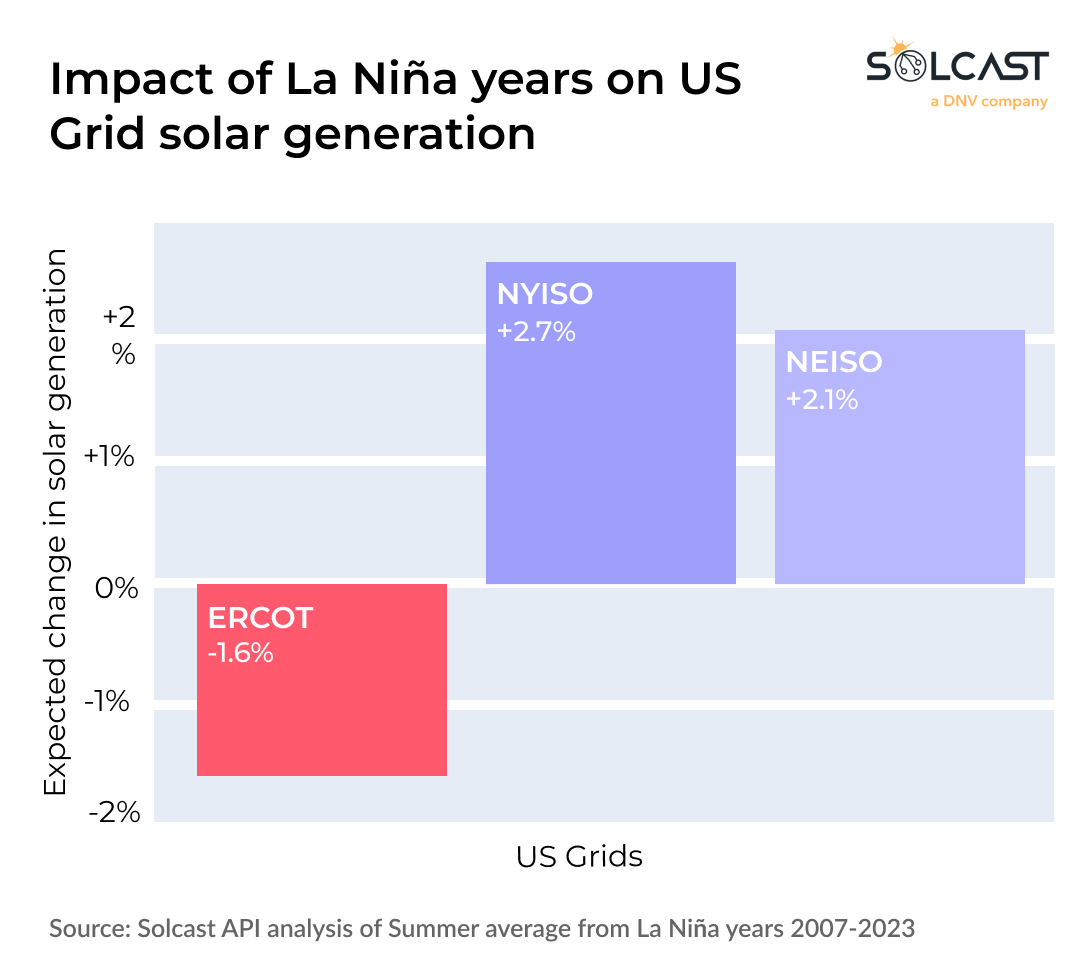
Using this climate analysis, it is possible to apply these possible weather patterns to the current distribution of solar generation across the US. Analysis using the Solcast API shows that a typical La Nina summer would mean 2.7% more rooftop solar generation for the New York ISO (NYISO), and 2.1% for New England ISO (NEISO). In contrast, the large number of Utility Scale assets in the Electric Reliability Council of Texas (ERCOT) sees lower production in a typical La Niña summer, down by -1.6%.
Monitor the weather and irradiance shifts that could happen as La Nina progresses. Create a Solcast API toolkit to help you optimise your solar operations, or reach out to our team for an extended trial.