


Typical Meteorological Year
Download a statistically representative “typical year” file built from 15 + years of satellite data for long-term yield modelling.
Bias and error validation of Solcast historical irradiance data against surface measurements
.avif)
These validation analyses assist users in evaluating the accuracy of Solcast’s historical time series data. This can be useful for estimating expected accuracy for your own region(s). These studies compare to quality-controlled surface measurement data from across the world. Users focused on live and forecast data should refer to our separate live and forecast data analysis. For users interested in TMY data, these historical analyses are the relevant resource, since TMY data is sourced from the historical time series. Further information on Solcast’s TMY methodology is also available here.
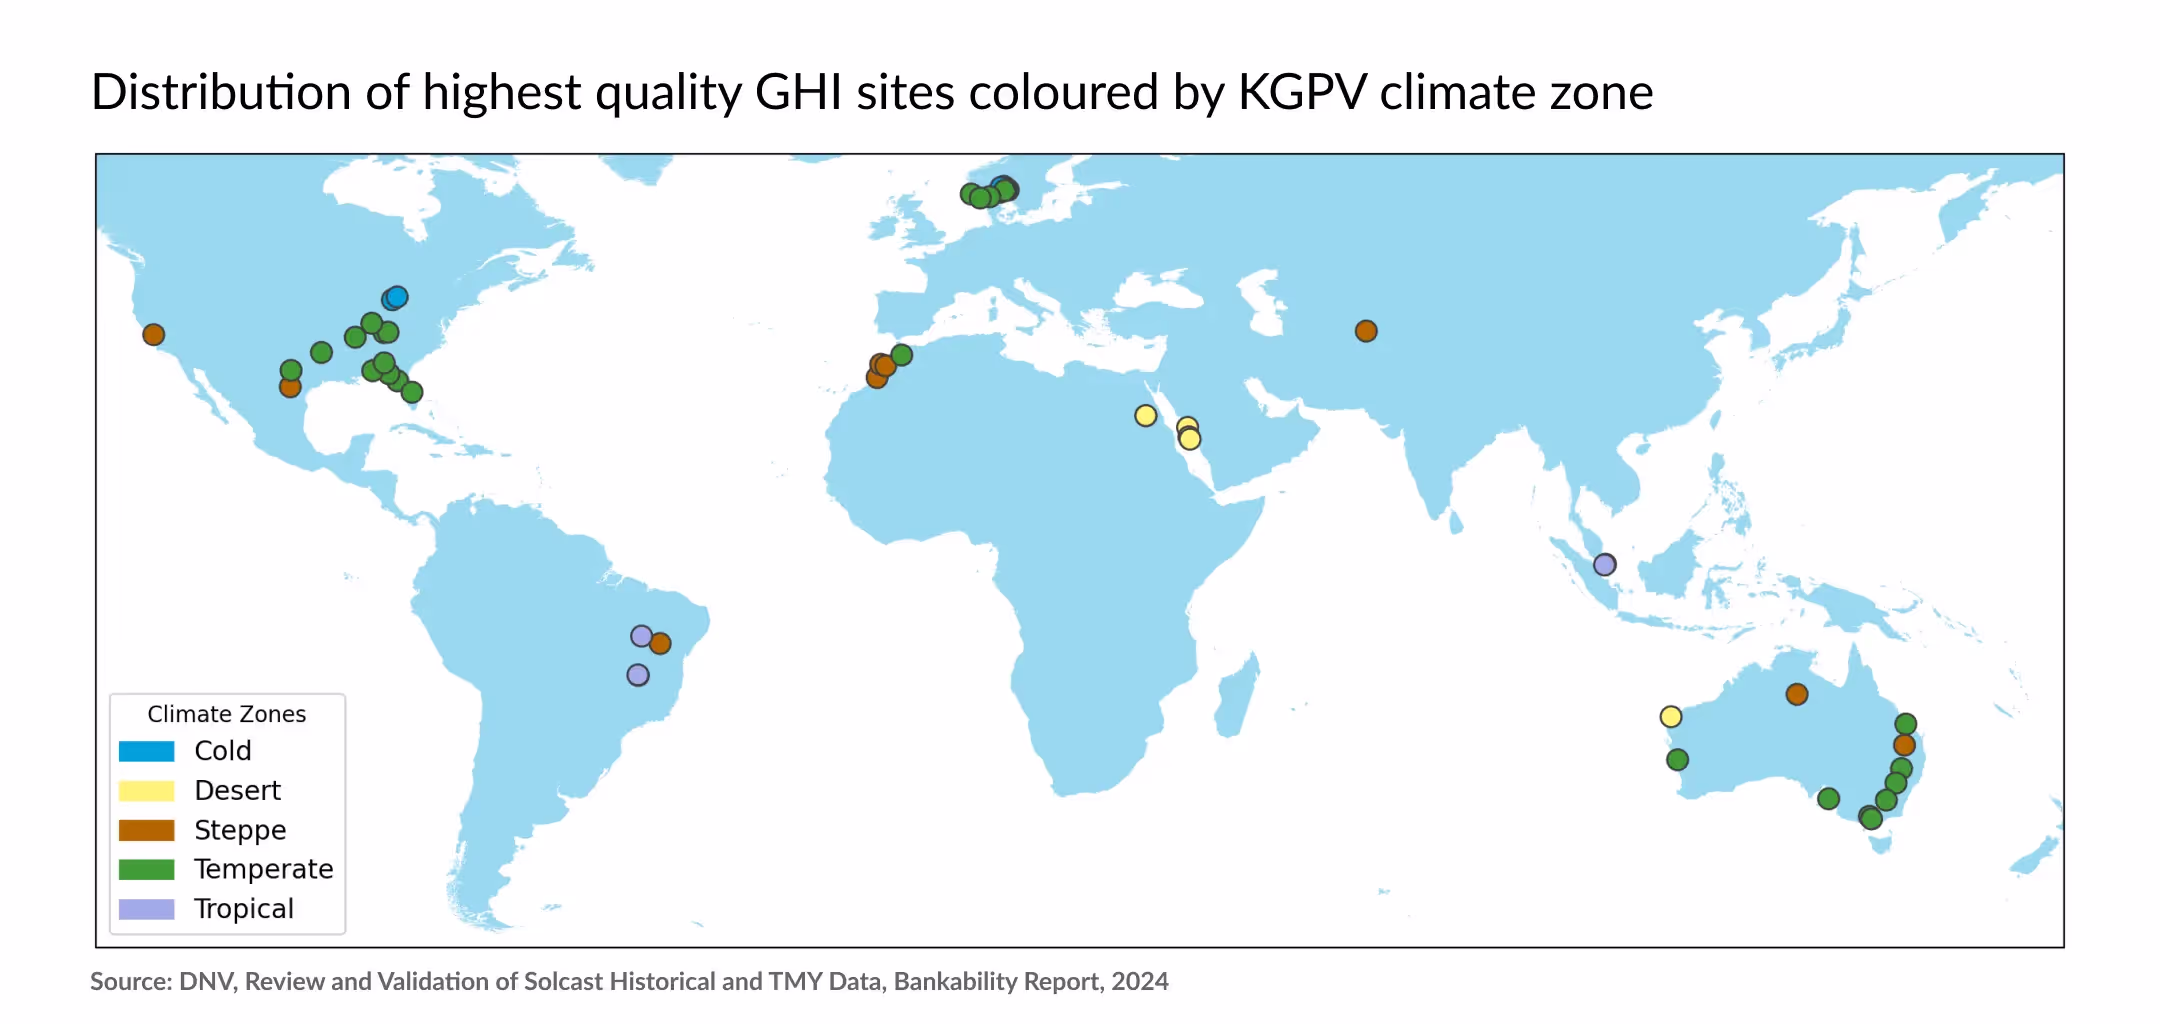
The most recent study, the DNV bankability report, was completed by DNV in 2023, published in early 2024. This study reviewed methodology and validated GHI and DNI against measurements from 207 sites globally. You can explore an interactive map providing a visual view of the DNV bankability results.
An earlier study was completed by Solcast in 2022 on 70 sites, for transparency, a summary of the details of that validation is contained at the bottom of this page. The bias and error statistics of the DNV and Solcast studies are very similar.
A selection of commonly-used statistics from each study are included here. For a full range of statistics, including at site level, and to request the raw data from the Solcast report, please contact the Solcast team.
The full report was published by DNV in February 2024. The study continued on validation work DNV started prior to acquiring Solcast in 2023. DNV reviewed Solcast’s irradiance and TMY methodology and conducted a global validation analysis of the Solcast historical time series (HTS) GHI and DNI data against surface irradiance measurements. Data was included from 207 sites of which 53 sites are considered highest quality, based on cleaning schedules, data quality and sensor classification.
The data used in the validation analysis was subject to an initial and secondary quality assurance process, and sites have been classified and grouped by continent, according to the World Bank approved administrative boundaries, and by Köppen-Geiger-Photovoltaic (KGPV) Climate Zones.
The study considers three main metrics per site and this data is provided for all sites in the full report: Mean Bias Difference/Error (MBD), Mean Average Difference/Error (MAD) and Root Mean Square Difference/Error (RMSD). The key findings for bias were:
Data | Mean Bias | Standard Deviation |
|---|---|---|
GHI - Highest Quality Sites | +0.05% | ±2.05% |
GHI - All sites | +0.33% | ±2.47% |
DNI - All sites | +1.5% | ±5.75% |
The report concluded as follows: “DNV finds the Solcast methodology to be consistent with industry best practices. DNV finds the results of the validation study to be within expectations and that the Solcast data is suitable for use to accurately predict project energy yield in energy assessment and for use in energy assessment for project financing purposes. The Solcast bias is considered low and there are limited variations between different regions and climatic zones for both GHI and DNI.”
This report was written and published by DNV, and is based on validation work that began prior to DNV's acquisition of Solcast. Solcast team members supported the DNV team in collection of data and the development of the report, but the final content and conclusions were agreed by DNV, and meets DNV's standards for rigour and quality.
DNV reviewed the Solcast irradiance and TMY methodology and found that it is consistent with industry best practices. The study assessed the varying inputs into the Solcast algorithm including our sources of geostationary weather satellite imagery and weather model data. Models were reviewed and validated as separate components:
Review of Solcast’s TMY methodology was also included along with the model reviews.
Data used in the study came from publicly available data sources, measurement stations used for project development and measurements from operational assets. Site selection focussed on achieving the best possible global coverage, specifically including most major solar markets. All sites provided data at a resolution of 1 hour or finer.
Sites were classified according to World Bank administrative boundaries for region, and using Köppen-Geiger-Photovoltaic (KGPV) classification for climate zones. These classifications were used to provide regional and climate zone breakdowns of validation data, as accuracy of solar irradiance estimates are expected to vary between regions and with climatic conditions. A breakdown of the results in this way is present in the full report.
Every site included in the study passed two rounds of quality assurance and additional exclusion criteria. Quality assurance processes ensured that data was excluded which exhibited unphysical qualities, sensor drift or calibration errors or was otherwise unsuitable. Exclusion criteria applied to sites that were at a very high elevation, at polar latitudes, did not provide sufficient time coverage or fell outside satellite coverage boundaries. This process ensures that sites used are both accurate and representative of typical solar asset locations.
A total of 207 sites were used for the validation study. These sites passed through both stages of quality assurance and the exclusion criteria. GHI measurements were available for all sites, shown below, however measurements of DNI are less frequently available and were available for a total of 117 sites, also below.
.avif)
DNV identified a total of 53 highest quality sites that were confirmed to have Class A pyranometers that were cleaned a minimum of every 2 weeks. The measurements at these locations are expected to be more accurate and validation performed at these locations more indicative of the performance of Solcast’s estimates than for other locations.
Metrics were calculated against hourly values of irradiance for all locations. Equations for the metrics used can be found in the full report.
The key results and findings of the results are below. Data for confidence intervals, regional breakdowns, and climate zone breakdowns are available in the full report.
Highest Quality GHI Sites | All GHI Sites | All DNI Sites | |
|---|---|---|---|
No. of sites | 53 | 207 | 117 |
Mean Bias | +0.05% | +0.33% | +1.50% |
Bias Std. Dev. | ±2.05% | ±2.47% | ±5.75% |
80% CI Bias (10% to 90%) | -2.57% to 2.67% | -2.84% to 3.50% | -5.87% to 8.86% |
90% CI Bias (5% to 95%) | -3.31% to 3.41% | -3.74% to 4.40% | -7.96% to 10.95% |
Mean nMAD (nMAE) | 10.37% | 10.33% | 19.97% |
Std. Dev. nMAD (nMAE) | ±5.03% | ±3.72% | ±5.94% |
Mean nRMSD (nRMSE) | 16.16% | 15.99% | 31.51% |
Std. Dev. nRMSD (nRMSE) | ±7.94% | ±5.74% | ±9.99% |
To understand how these results might reflect accuracy for your region and assets, you can use the below interactive map to see KGPV climate zones globally and our distribution of sites. You can select climate zone and region to see aggregate results, representative sites, and the source data for each site is available.
Locations of some sites have been obfuscated for confidentiality reasons, indicated locations are representative and in the same climate zone.
See how these results compare to both free and paid alternatives in the market here.
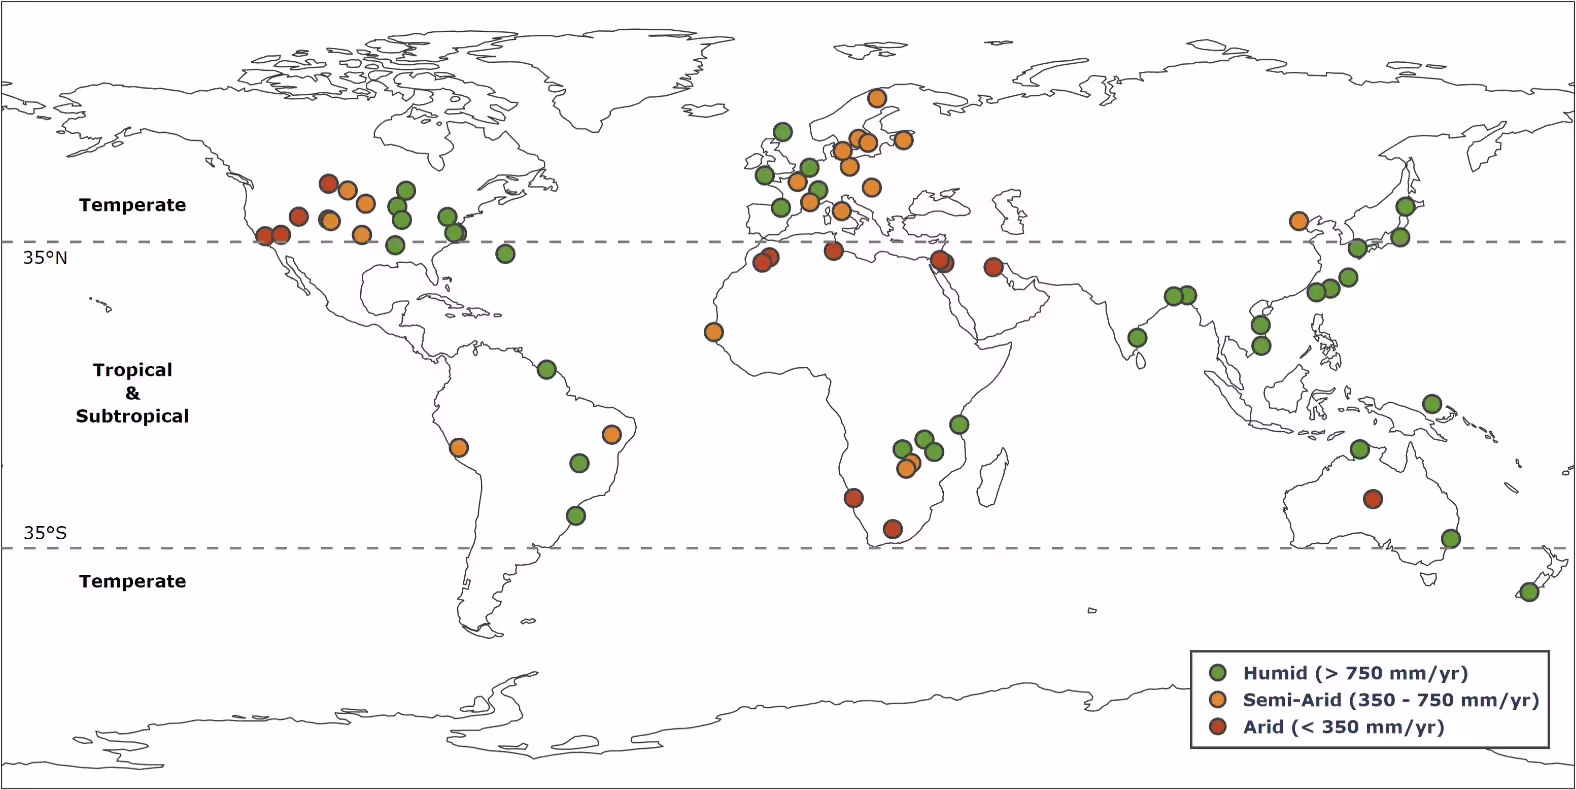
A global, accuracy verification analysis of Solcast Historical Data was performed in 2022, using surface measurements from 70 sites spanning a range of climate types and latitude zones. The measurements span 2007 to 2021. Results were compared to the commonly used ERA5 reanalysis dataset (publicly available from the European Centre for Medium-Range Weather Forecasts, ECMWF).
The mean bias in estimated actual GHI across all the measurement sites is -0.1%, compared with the ERA5 which has a +2.4% bias. The hourly-average MAPE of the Solcast GHI estimates across all sites is 10.7% compared with 18.4% for ERA5. For DNI, bias across all sites is +1.3% compared to ERA5 values of +23.3%, and hourly average MAPE across all sites is 23.6% compared with ERA5 values of 46.9%.
Metric | Bias | Bias | nRMSE | MAPE |
|---|---|---|---|---|
Solcast GHI | -0.1% | 2.2% | 17.5% | 10.7% |
Solcast DNI | +1.3% | 6.9% | 40.4% | 23.6% |
This analysis uses research grade, quality-controlled surface measurements from a variety of sources, including but not limited to, the Baseline Surface Radiation Network (BSRN; global), the Surface Radiation Budget Network (SURFRAD; US) and the enerMENA Meteo Network (Middle East and North Africa). The sites used were selected for (1) quality, characterised by robust calibration and maintenance standards and quality control of data - this is challenging for irradiance measurements, where calibration and maintenance often cause large errors; (2) recency, i.e. data is available for recent periods so that the analysis can use recent Solcast algorithmic configuration, and for relevance to newer customer sites; (3) availability, as much as possible the measurements should be non-private, and readily available to users who may want to replicate the results; and (4) broad geographic and climate-type coverage, so that users can estimate accuracy for their own sites.
The following table shows statistics for the normalised bias, Mean Absolute Percentage Error (MAPE) and normalised Root Mean Square Error (nRMSE), as defined in the above-mentioned NREL 2013 analysis, of GHI.
Errors in Estimated Actuals for GHI Data: hourly average, nocturnal zeros excluded | ||||||||||
|---|---|---|---|---|---|---|---|---|---|---|
Site type | Estimate | Bias | Bias | nRMSE | MAPE | |||||
Tropical/Sub-Tropical | Solcast | +0.1% | 3.2% | 11.5% | 7.3% | ERA5 | +1.6% | 3.3% | 19.0% | 11.5% |
Tropical/Sub-Tropical | Solcast | +0.5% | 2.3% | 17.9% | 11.3% | ERA5 | +2.9% | 4.9% | 32.3% | 21.2% |
Temperate | Solcast | -0.7% | 1.5% | 19.7% | 11.8% | ERA5 | +2.9% | 5.1% | 31.1% | 18.6% |
Temperate | Solcast | -0.1% | 1.6% | 19.6% | 11.4% | ERA5 | +1.4% | 3.2% | 34.4% | 21.2% |
Global average | Solcast | -0.1% | 2.2% | 17.5% | 10.7% | ERA5 | +2.4% | 4.4% | 29.7% | 18.4% |
The following table shows statistics for the normalised bias, Mean Absolute Percentage Error (MAPE) and normalised Root Mean Square Error (nRMSE), as defined in the above-mentioned NREL 2013 analysis, of DNI.
Errors in Estimated Actuals for DNI Data: hourly average, nocturnal zeros excluded | ||||||||||
|---|---|---|---|---|---|---|---|---|---|---|
Site type | Estimate | Bias | Bias | nRMSE | MAPE | |||||
Tropical/Sub-Tropical | Solcast | -2.1% | 8.0% | 25.8% | 17.0% | ERA5 | +13.8% | 13.4% | 43.1% | 31.7% |
Tropical/Sub-Tropical | Solcast | +4.4% | 7.7% | 41.2% | 25.6% | ERA5 | +32.4% | 22.9% | 74.1% | 55.1% |
Temperate | Solcast | -0.8% | 4.9% | 45.8% | 25.2% | ERA5 | +21.8% | 21.4% | 69.4% | 46.8% |
Temperate | Solcast | +3.4% | 4.9% | 45.8% | 24.5% | ERA5 | +21.6% | 11.3% | 73.8% | 50.1% |
Global average | Solcast | +1.3% | 6.9% | 40.4% | 23.6% | ERA5 | +23.3% | 19.8% | 66.4% | 46.9% |
The purpose of this validation analysis is to enable users to estimate Solcast’s historical timeseries accuracy for their site(s) prior to subscription or integration effort. It is based on data across 15 years, compared to surface measurements from high-quality measurement sites. Also included are error statistics, and benchmarks against a common alternative.

Download a statistically representative “typical year” file built from 15 + years of satellite data for long-term yield modelling.
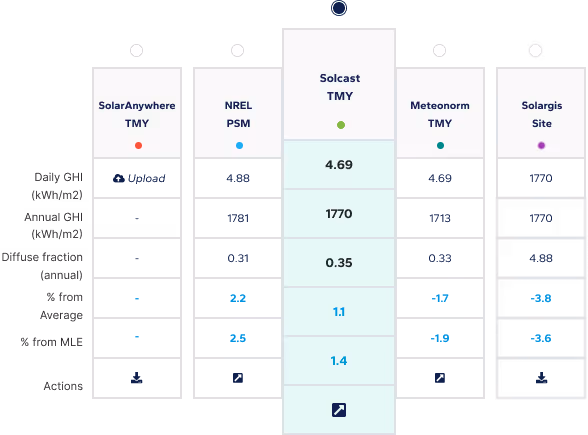
Compare multiple satellite data sets side-by-side to choose the most bankable resource file for your site.
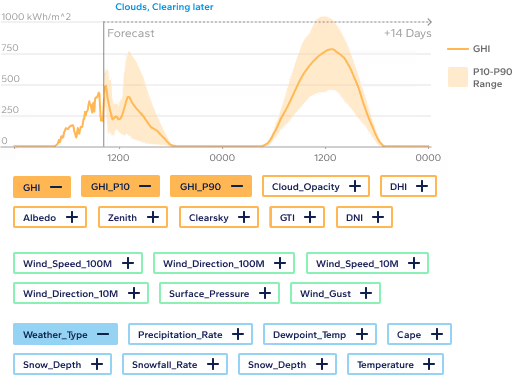
Access industry-leading solar forecasts up to 14 days ahead, combining satellite nowcasting and weather models for precision energy planning.
How do you measure solar radiation?
The industry standard instrument to measure solar radiation is a class-A pyranometer. However, physical sensors require regular maintenance and calibration and can experience downtime that leads to data gaps. In 2023 DNV published a bankability study which validated Solcast’s satellite-based irradiance data with measurements from Class A pyranometers cleaned at least every two weeks. Combining measurements with a high-quality satellite irradiance data source, like Solcast, can give you more accurate, reliable solar irradiance data for your assets, especially when using measurements for a fleet of assets.
Why is validation important for historical solar irradiance data?
Validation is crucial for ensuring the accuracy and reliability of historical solar irradiance data. It helps identify and correct biases, improving the accuracy of solar irradiance estimates while reducing uncertainty in solar project planning and performance predictions.
How to evaluate historical solar irradiance data accuracy?
Historical solar data accuracy can be evaluated by comparing the data against high-quality ground-based measurements from weather stations and solar monitoring sites or against other solar data providers. Our team has consolidated guidelines on how to evaluate satellite-derived irradiance. Comparing bankable satellite-derived irradiance to measurements from ground sensors requires the highest quality sensor data for the comparison to be accurate.
Check the accuracy of Solcast data in your region using our Historical Accuracy interactive map.
What is bankable historical solar data?
Bankable solar data meets several criteria: independent validation across multiple globally distributed sites, coverage of various geographic and climatological regions, public availability of all details, and a thorough validation report that considers methodology and models for historical and TMY data. Solcast historical data shows a bias of only 0.33% for all GHI sites and just 0.05% against the highest quality measurements, making it bankable for solar resource assessment and planning.
What does bankability mean in solar design and financial modeling?
In solar design and financial modeling, bankability refers to the reliability and credibility of solar data, predicted performance and asset technology or management to secure financing from investors and financiers. Bankable projects are those that are likely to perform as expected and generate expected financial returns. To achieve this, you can access bankable, accurate historical solar irradiance data via the Solcast API toolkit.
Subscribe to our newsletter to keep up to date with all the latest news.