


Dr. Hugh Cutcher
January 31, 2024
Share this post
This blog post was originally published on 31 January 2024. It has been updated to include the latest Grid Aggregations projections for the total eclipse on April 8th. This reflects some increases to capacity since initial analysis in January and the addition of data for PJM.
As solar capacity increases, the grid impact of subsequent major solar events also increases. On April 8th, a total eclipse will pass from Mexico, across Texas and up the East Coast, with most of the continental US experiencing a significant drop in solar generation. The eclipse will occur from Noon to the early afternoon, when solar generation is at its highest. It is too early to predict weather conditions for the day, in particular high resolution cloud modelling, so this analysis is based on Solcast clearsky irradiance modelling.
To forecast the impact the eclipse will have on your assets, create a commercial account in the Solcast Toolkit.
Impacts of April 8 Total Eclipse on irradiance
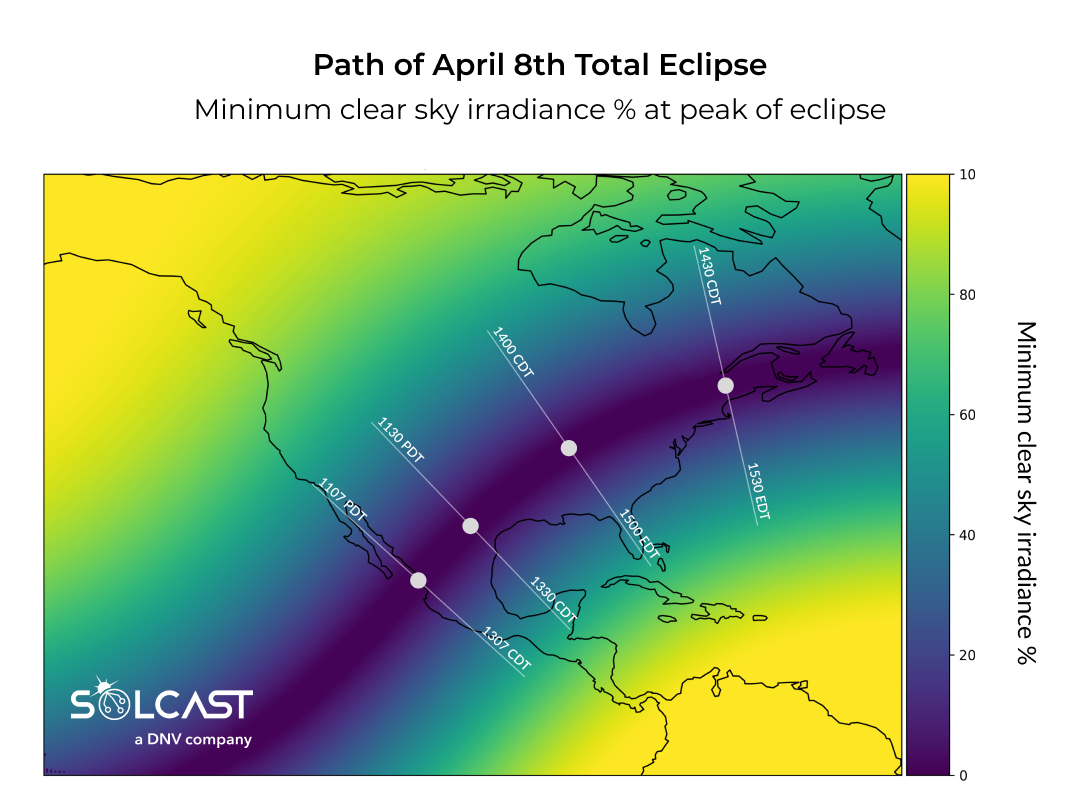
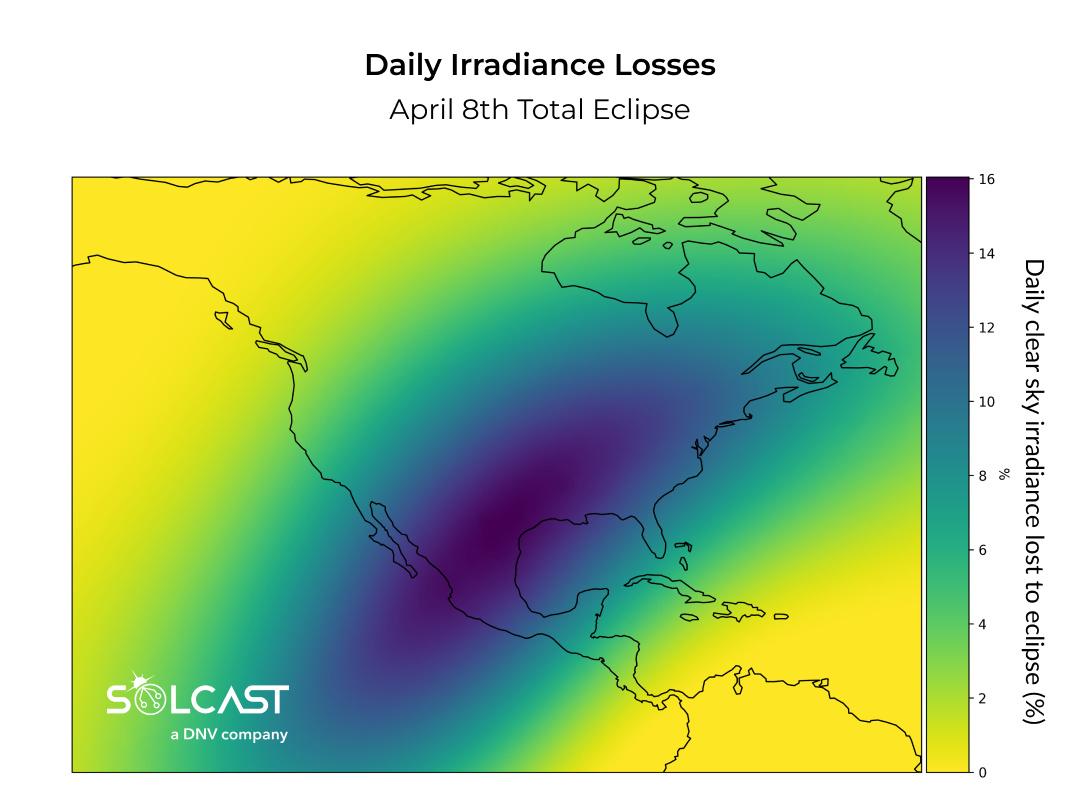
Areas in the totality, where the moon completely blocks the sun, will see a 100% loss in solar generation for the duration of the totality. But the overall effects of the eclipse will cost up to 16% of daily total clear sky irradiance in areas most affected.
Whilst it is too early to predict the precise cloud impacts on the day, Grid Operators will already be preparing for the maximum potential impact, a temporary total loss of solar generation and fast ramp of solar decreasing then increasing. For areas directly in the path of the eclipse, the maximum duration will be over 90 minutes of impacted generation, and a total loss of up to 6 minutes. In every grid analysed, the rate at which solar generation drops off and then picks back up again, is faster than grids normally seen in the morning and evening.
How much power could be lost in US grids due to the Eclipse?
Texas Impact
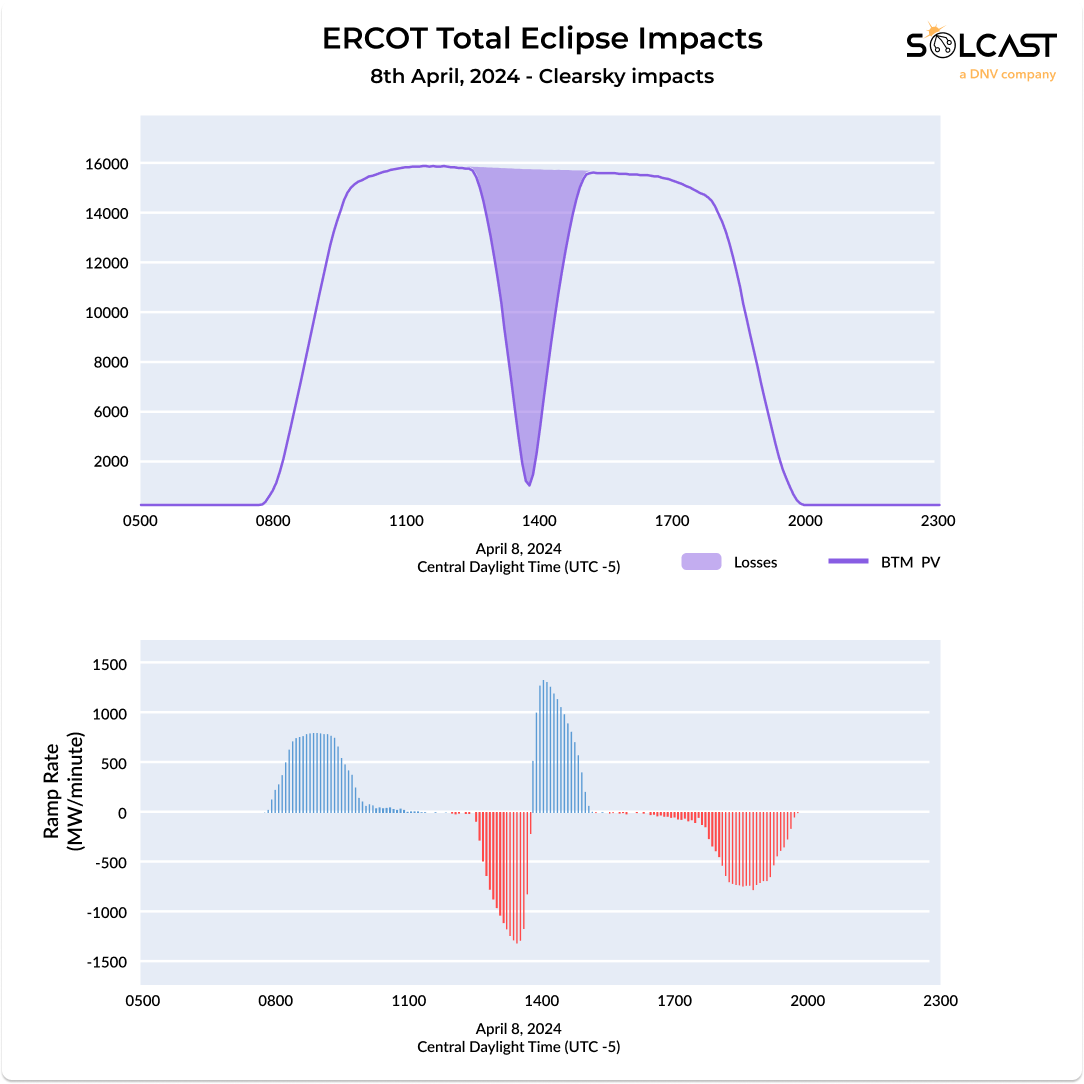
The large proportion of Utility Scale assets in ERCOT, mean that Texas will be heavily impacted by the effects of the eclipse. Individual assets will lose up to 16% of their daily irradiance, but the wide area covered by ERCOT means that the overall loss to the grid will be up to 10.9% of daily utility scale solar generation. At current capacity, that would be 17.3GWh, though the rapid increase in capacity in ERCOT, and known projects coming online before April makes it likely this number could be higher. Solcast’s grid aggregation model shows that the ramp will be slightly steeper than normally seen in the morning or evening, peaking at a rate of 250MW/minute. The fast change in generation is what can cause instability in the grid, so asset managers, energy traders and the grid operators will be working to maintain stability whilst making the most of volatile energy prices.
East Coast Impact
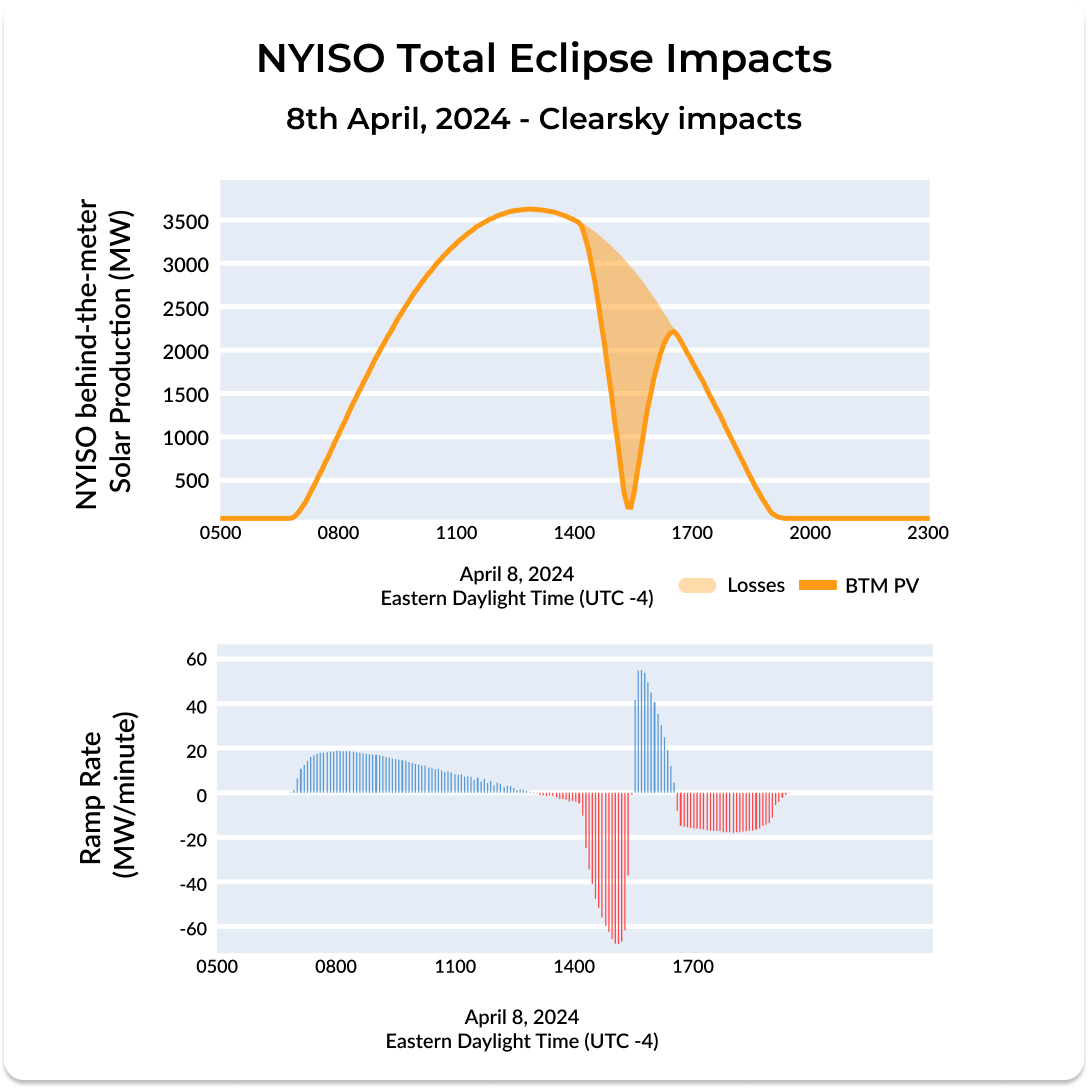
As the eclipse moves up the East Coast, it will impact both NYISO and ISO-NE. These regions have less utility scale solar than Texas, so the impact will mostly be seen in ‘behind-the-meter’ residential rooftop solar generation. For each grid the impacts are fairly similar. NYISO will lose up to 10.91% of their daily rooftop generation, and up to 3.1GWh of power.
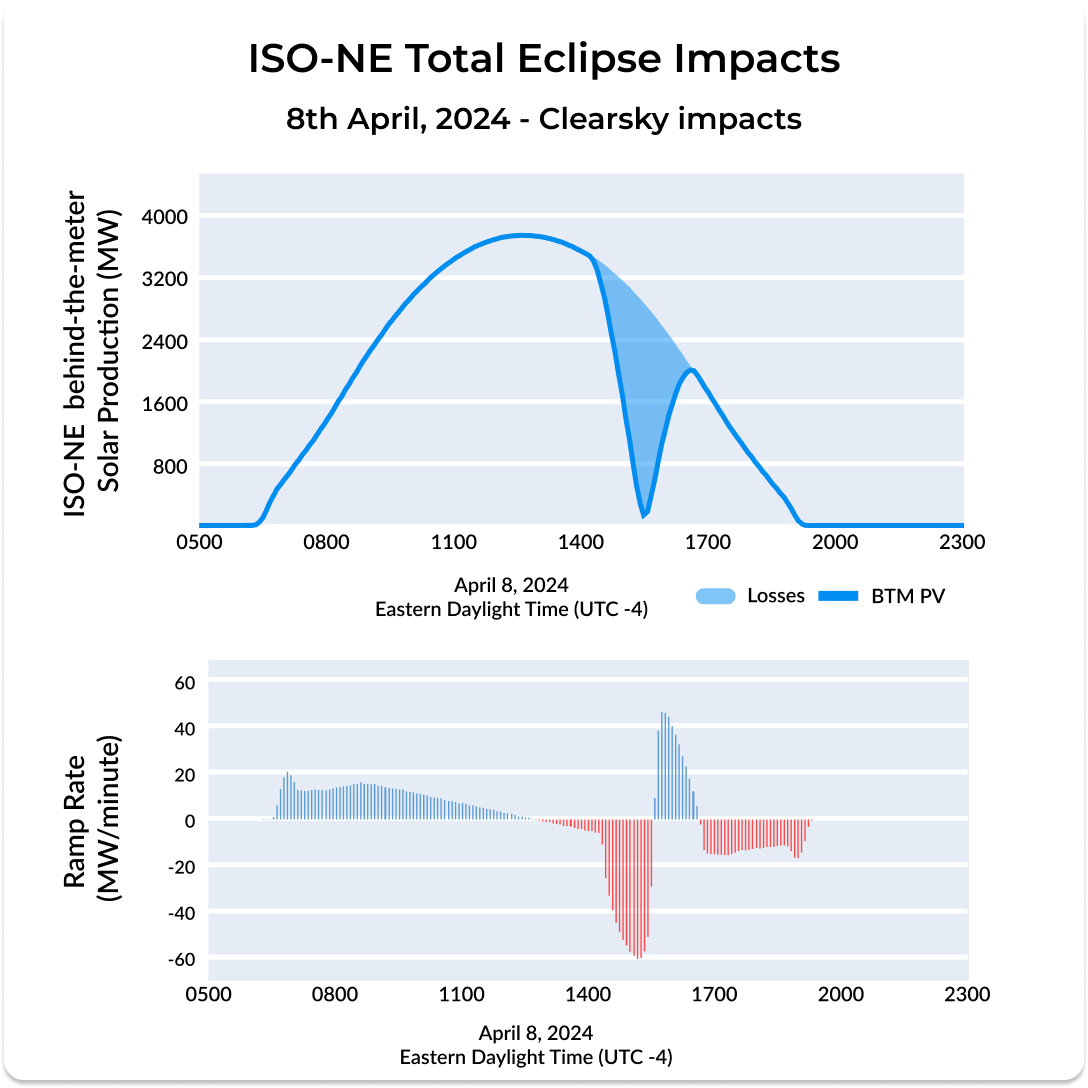
Being further south, and hit by the eclipse slightly earlier explains the difference with ISO-NE. New England will lose up to 9.85% of their daily behind-the-meter generation, though differences in installed capacity makes this a higher 3.7GWh. Notably the ramp rate is much higher than the morning or afternoon ramps, as irradiance will drop from almost the daily maximum to zero in approximately 40 minutes. This will require active management from the grid operators to maintain stability.
California Impact
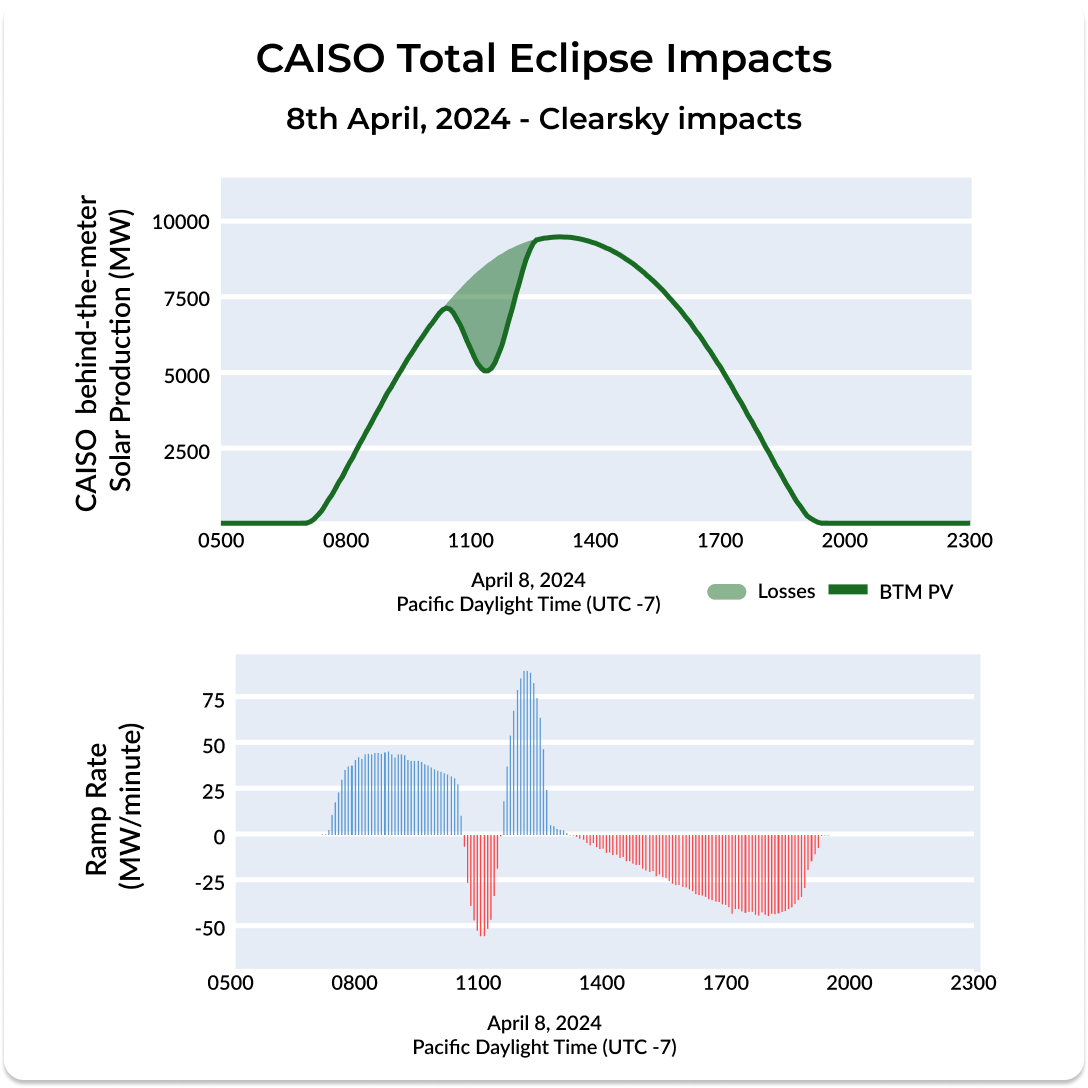
CAISO in California will also see impacts from this eclipse, though being so far from the path of totality, the effects will be less than seen in the partial annular eclipse in October 2023. Despite seeing a lower proportional effect from grids in the North-East, only 5.72% of daily generation, increased levels of rooftop solar in California mean that the energy losses will be greater than either NYISO or ISO-NE, up to 4.0GWh.
Midwest Impact

As the eclipse crosses the expansive PJM grid, a significant impact is anticipated on both 'behind-the-meter' and utility-scale solar generation. 'Behind-the-meter' residential rooftop solar generation is expected to lose up to 11.28% of daily solar generation, amounting to a loss of approximately 5.47 GWh. For utility-scale assets, the impact is similar, with an anticipated loss of 6.40 GWh, 10.14% of daily utility-scale solar generation. Depending on cloud impacts, energy losses due to the eclipse in PJM could be the second largest for US grids, following ERCOT.
Whilst the impact of this eclipse is significant, it is predictable, and grid operators are already preparing and planning for the impacts. Large storm events, snow dump events and large heavy cloud fronts are less spectacular but can have even bigger impacts on whole day solar generation. These events are also harder to plan for and predict, which makes it more important for asset owners and grid operators to plan and manage the impact of weather on solar generation as solar increases in the generation mix.
How does Solcast model the effects of the eclipse on US grids?
At Solcast, we begin by tracking the relative positions of the Sun and Moon using an open-source software package called PyEphem, developed by Brandon Rhodes. Our calculations are then focused on the time periods and locations affected by the eclipse.
The analysis above is completed on clearsky data which includes projected aerosol and atmospheric conditions, but in the 14 days prior to the eclipse there will be enough weather data to model cloud impacts on irradiance. Solcast's satellite cloud tracking system models cloud cover and its impact on irradiance in real-time. By combining live satellite data driven models of cloud cover with our eclipse irradiance models, we can provide asset managers, grid operators and PV asset owners with a more detailed forecast of how the eclipse will impact power generation.
To analyse the eclipse's impacts on grids, our team monitors reported installed capacity information for accurate geographic distribution. We then use the Solcast Grid Aggregations to forecast and estimate the aggregate power output from hundreds of distributed PV systems.
Discover how you can use Solcast's cloud tracking model and Grid aggregations into your operations. Chat with our team or test the data via our commercial toolkit.