


Harry Cheselwoods
October 4, 2024
Share this post
When speaking with customers, we’re often asked to provide a “cloud cover” forecast. Typically, that question actually means:
“How much cloud will cover my solar assets”
But there’s actually many different cloud parameters used in meteorology. As clouds are the primary inhibitors of irradiance - and therefore solar generation - it’s key that you understand the difference and the effect this can have on your solar generation.
There are two parameters that are commonly mentioned in regards to the impact of clouds on surface irradiance: cloud cover and cloud index (sometimes known as optical thickness, cloud thickness, or cloud opacity). In the Solcast API, we refer to this second metric as ‘cloud opacity’, which we will be using throughout the discussion in this article.
While both parameters are important, they serve different purposes. Choosing the wrong metric can lead to inaccurate solar forecasts, resulting in suboptimal energy generation estimates and inefficient grid management.
What is cloud cover?
‘Cloud cover’ is a metric used to measure the fraction of the sky that is covered by clouds. This is often used in aeronautical applications, or satellite communications that are impacted by clouds.
In this image, the bright white areas represent regions with significant cloud cover, where clouds are present in a large proportion of the sky. The darker gray areas show regions with less cloud cover, where parts of the sky remain clear. You can see in this image, large areas are seeing total cloud coverage, because there is thin cloud in 100% of the sky.
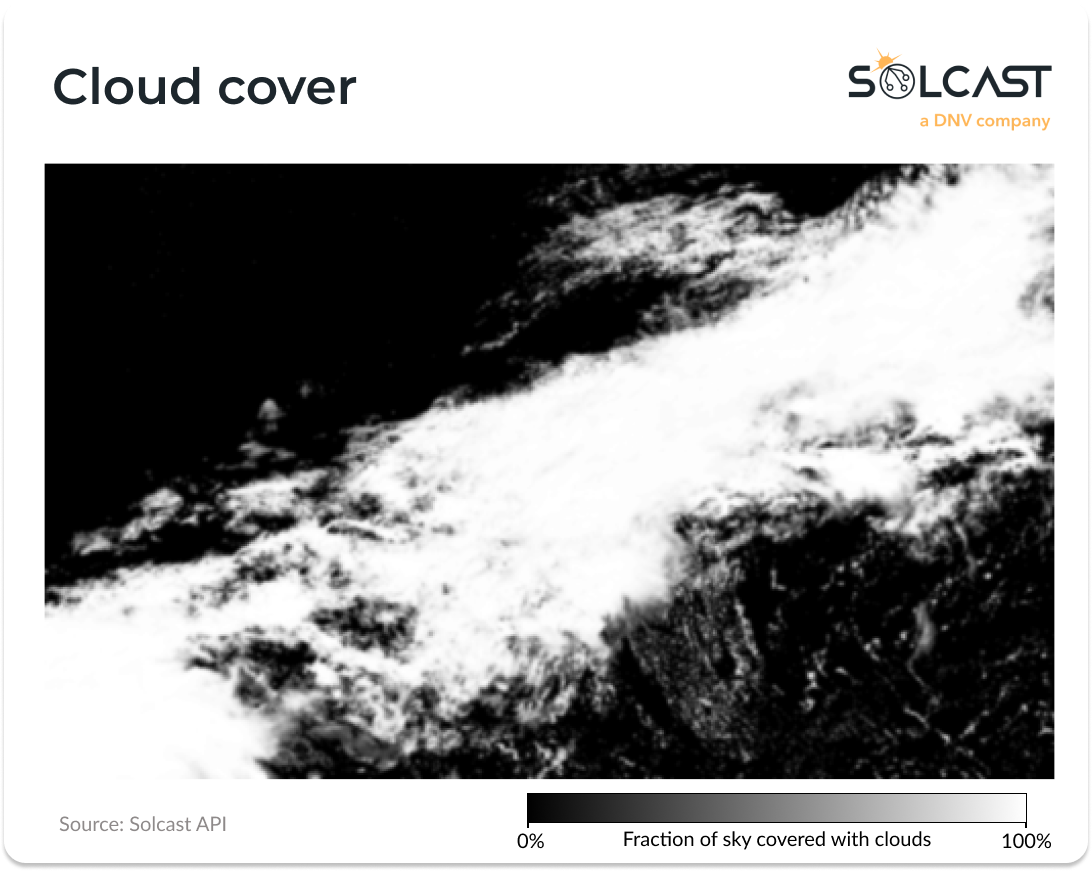
As a meteorological parameter, ‘cloud cover’ provides a measure of cloud presence in the area around a location but isn’t as much as a key driver for the amount of irradiance your solar assets are receiving.
What is cloud opacity?
‘Cloud Opacity’, also referred to as cloud index or cloud optical thickness, measures how opaque the clouds are. This makes it a key measure for solar generation, as how much irradiance is reflected or scattered by the clouds as it passes through the atmosphere determines how much makes it to your solar assets (and how diffuse it is). Not all clouds have the same properties- some are thin and allow more sunlight to pass through, while others are dense and significantly reduce irradiance. Importantly, where cloud cover considers all the clouds visible in the sky, Solcast’s cloud opacity measure is just for the clouds between a location and the sun (i.e. the cloud that impacts irradiance for your assets).
This image shows cloud opacity for the same area and same time stamp as above. Because cloud opacity captures thickness, this shows much more detail in the cloud coverage, and you can see areas with thicker or thinner clouds.
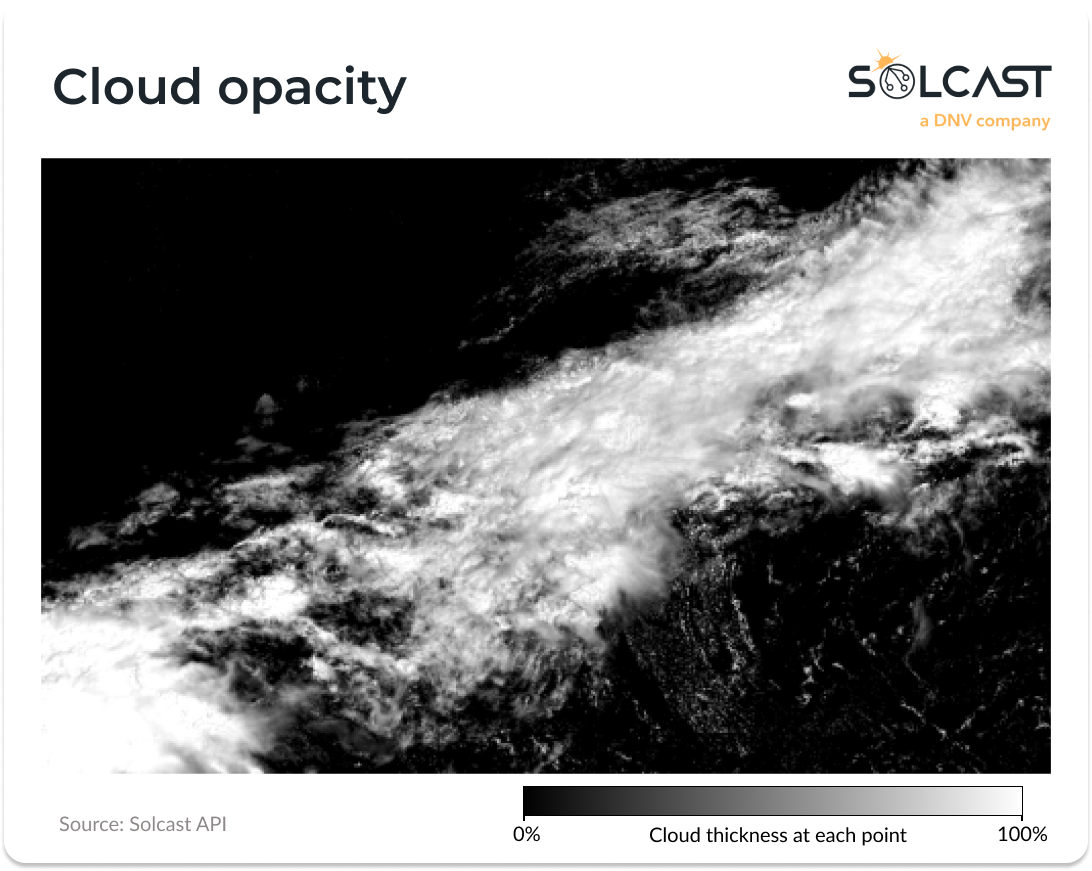
Cloud opacity is important, because it’s not just a binary factor of is or isn’t there cloud present. Thin clouds may allow most irradiance to pass through, while thicker clouds have a greater effect, changing the ratio of direct to diffuse irradiance and drastically influencing energy generation.
Which metric is better for solar energy applications?
While both cloud cover and opacity offer insights, cloud opacity provides a more precise and actionable measurement of how much irradiance reaches your PV assets. Cloud cover shows the extent of cloud but doesn’t account for cloud thickness which is an essential factor in solar forecasting. It doesn’t distinguish between a sky full of thin clouds, and a heavy front of thick clouds that is appearing on the horizon.
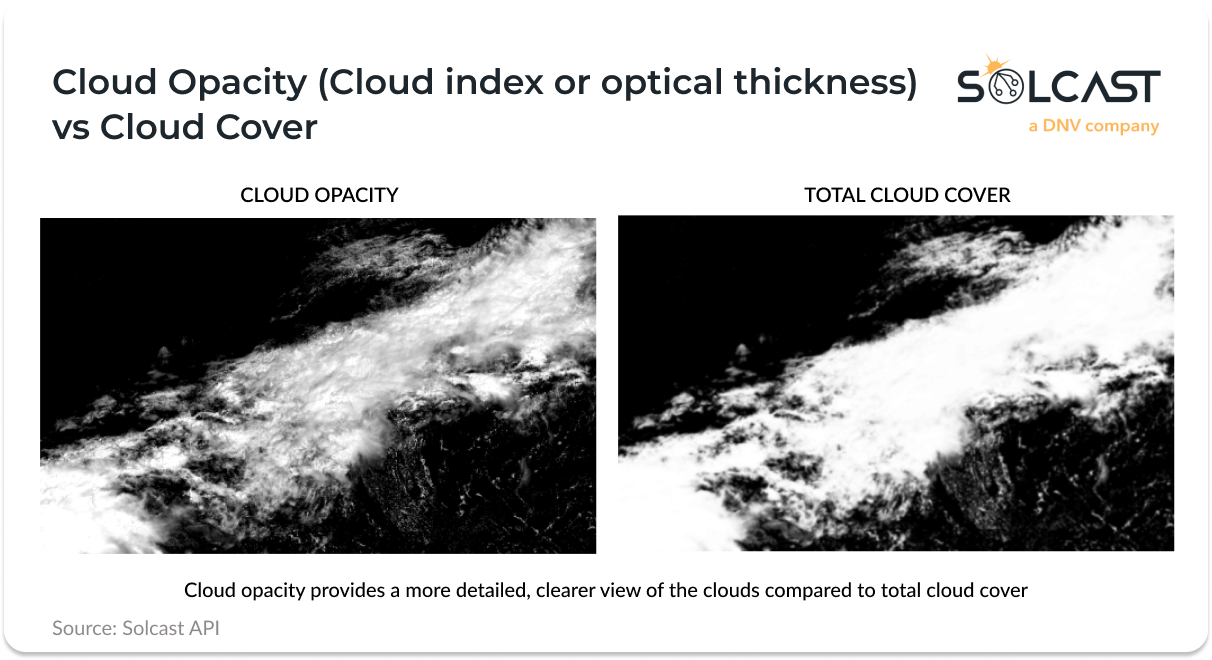
For example, on the left you’re able to see areas that have variations in the cloud thickness, even in the middle of the cloud band. For solar considerations, this will result in variations in irradiance for assets as the cloud passes overhead. Accounting for the differences is only possible with a very high resolution cloud model that tracks clouds in fine detail.
If you're not tracking cloud opacity, you’re not able to accurately model the production of solar assets, as you’re not tracking how thick the clouds are. Especially in sub-hourly models, or where you require highly accurate forecasts or actuals, you need an irradiance model that models cloud opacity.
Using cloud opacity in the Solcast API
Solcast provides over 30 solar, irradiance and weather parameters, including cloud opacity. Our focus on cloud opacity allows our customers to utilise more accurate forecasts by accounting for the variability in cloud thickness.
By incorporating cloud opacity, Solcast enables PV operators to optimize production, reduce forecasting errors, and enhance solar energy operations. Access to the right solar data, including precise cloud opacity measurements, is critical for making informed decisions that improve energy efficiency and grid management. With our advanced data services, solar developers can better predict production scenarios, improving efficiency and reliability.
While clear skies are ideal, accurately modeling the impact of clouds is also crucial. And that's where cloud opacity gives you the edge over cloud cover as your metric. Try it on the Solcast API toolkit or reach out to our team to learn more.