


Dr. Hugh Cutcher
February 6, 2025
Share this post
This blog post was originally published on 7 December 2023. It has been updated to include insights from the latest independent accuracy validation study and our interactive validation data tools.
This is Part II of a three-part series on evaluating irradiance and PV power accuracy. See also Evaluating accuracy I: Satellite-derived irradiance data and Evaluating accuracy III: PV power data.
Assessing Vendor Suitability
Step 1. Review the vendors’ documentation and published accuracy information
The first stage of assessing a forecast vendor is understanding their methodology and ensuring that approach meets your needs. Regardless of the level of accuracy you need, you should ensure that the data you’re considering has an appropriate and verified methodology and validation documentation freely available. Vendors that choose not to make their methodologies available, are likely using methods that aren’t validated or rigorously tested. For solar irradiance or PV power forecasting, you may want to check for the following attributes:
- Satellite cloud tracking and nowcasting. Very few forecast vendors do this, and without it you’ll generally get poor results in the +15 minute to +4 hour ahead horizons. Also, if your PV power measurements are often curtailed or affected by varying availability, which is the case for most utility-scale projects, a vendor without satellite cloud tracking will sometimes find it impossible to discriminate clouds from plant issues in their training dataset, which will affect the real forecast results.
- Aerosol tracking. The weather models that most vendors rely on as their sole spatial input data source typically exclude aerosols. If a vendor isn’t using real aerosols data, you’ll likely experience poor results during pollution, dust, smoke or ash events.
- Direct treatment of snow soiling. Most vendors do not handle snow soiling explicitly, resulting in very poor PV power forecast performance on perhaps 10 or 20 days each year. In theory, their empirical or machine learning models should be capable of noticing and predicting snow soiling events, however this requires a long training period which isn’t often feasible, and requires the model to have access to the appropriate input data and features.
- Direct treatment of solar eclipses. Many vendors do not handle solar eclipses either, which can lead to embarrassing and costly misses.
When reviewing validations, look for standard error metrics like nMAE, MAPE, or nMBE that can be compared between vendors, paying attention to how these metrics are calculated. These commonly published metrics allow for a quick and easy to perform comparison. Also note that you should expect error metrics to be higher for forecasts than historical data, if you are assessing Live or Historical data, read our thoughts on how to assess those sources here.
Solcast publishes validation statistics for forecasts here, to allow anyone in the industry to review how we produce our forecasts and validate the results. A recent Solcast study evaluated forecast performance at multiple forecast horizons across 135 sites globally, each with 1-4 years of site data. To ensure the findings are actionable and valuable, the study:
- Measured performance against multiple irradiance metrics and power modeling scenarios
- Provides results for multiple forecast horizons for each site, region, and climate zone
- Included comparisons with GFS and smart persistence models
- Presented the results in an interactive and filterable Forecast Accuracy Map and table
.gif)
You will see this explanation includes a summary of the site selection criteria and that data was not manipulated or trained on measurements for those locations. If you would like more information about how these studies were conducted, or the raw data, get in touch with our commercial team and we will provide that to you.
Step 2. Review third party forecast accuracy studies
Independent studies are rare because they require a number of vendors to agree to participate, however when they do occur they can produce very useful information for buyers. The ideal study will include multiple vendors, multiple time-horizons, multiple sites and a long time period. If a vendor makes no mention of such studies, you should ask them if they have ever participated in any, and if so you can ask to see the results.
In late 2023, EPRI conducted a thorough and rigorous 12 week study of forecast accuracy over multiple sites in the United States using their Solar Forecast Arbiter tool. The trial, conducted in partnership with a top 3 U.S. utility, included 5 large solar plants. Data was submitted by 9 different vendors over this time period on an hourly basis for 5 different time horizons from hour ahead to day-ahead.
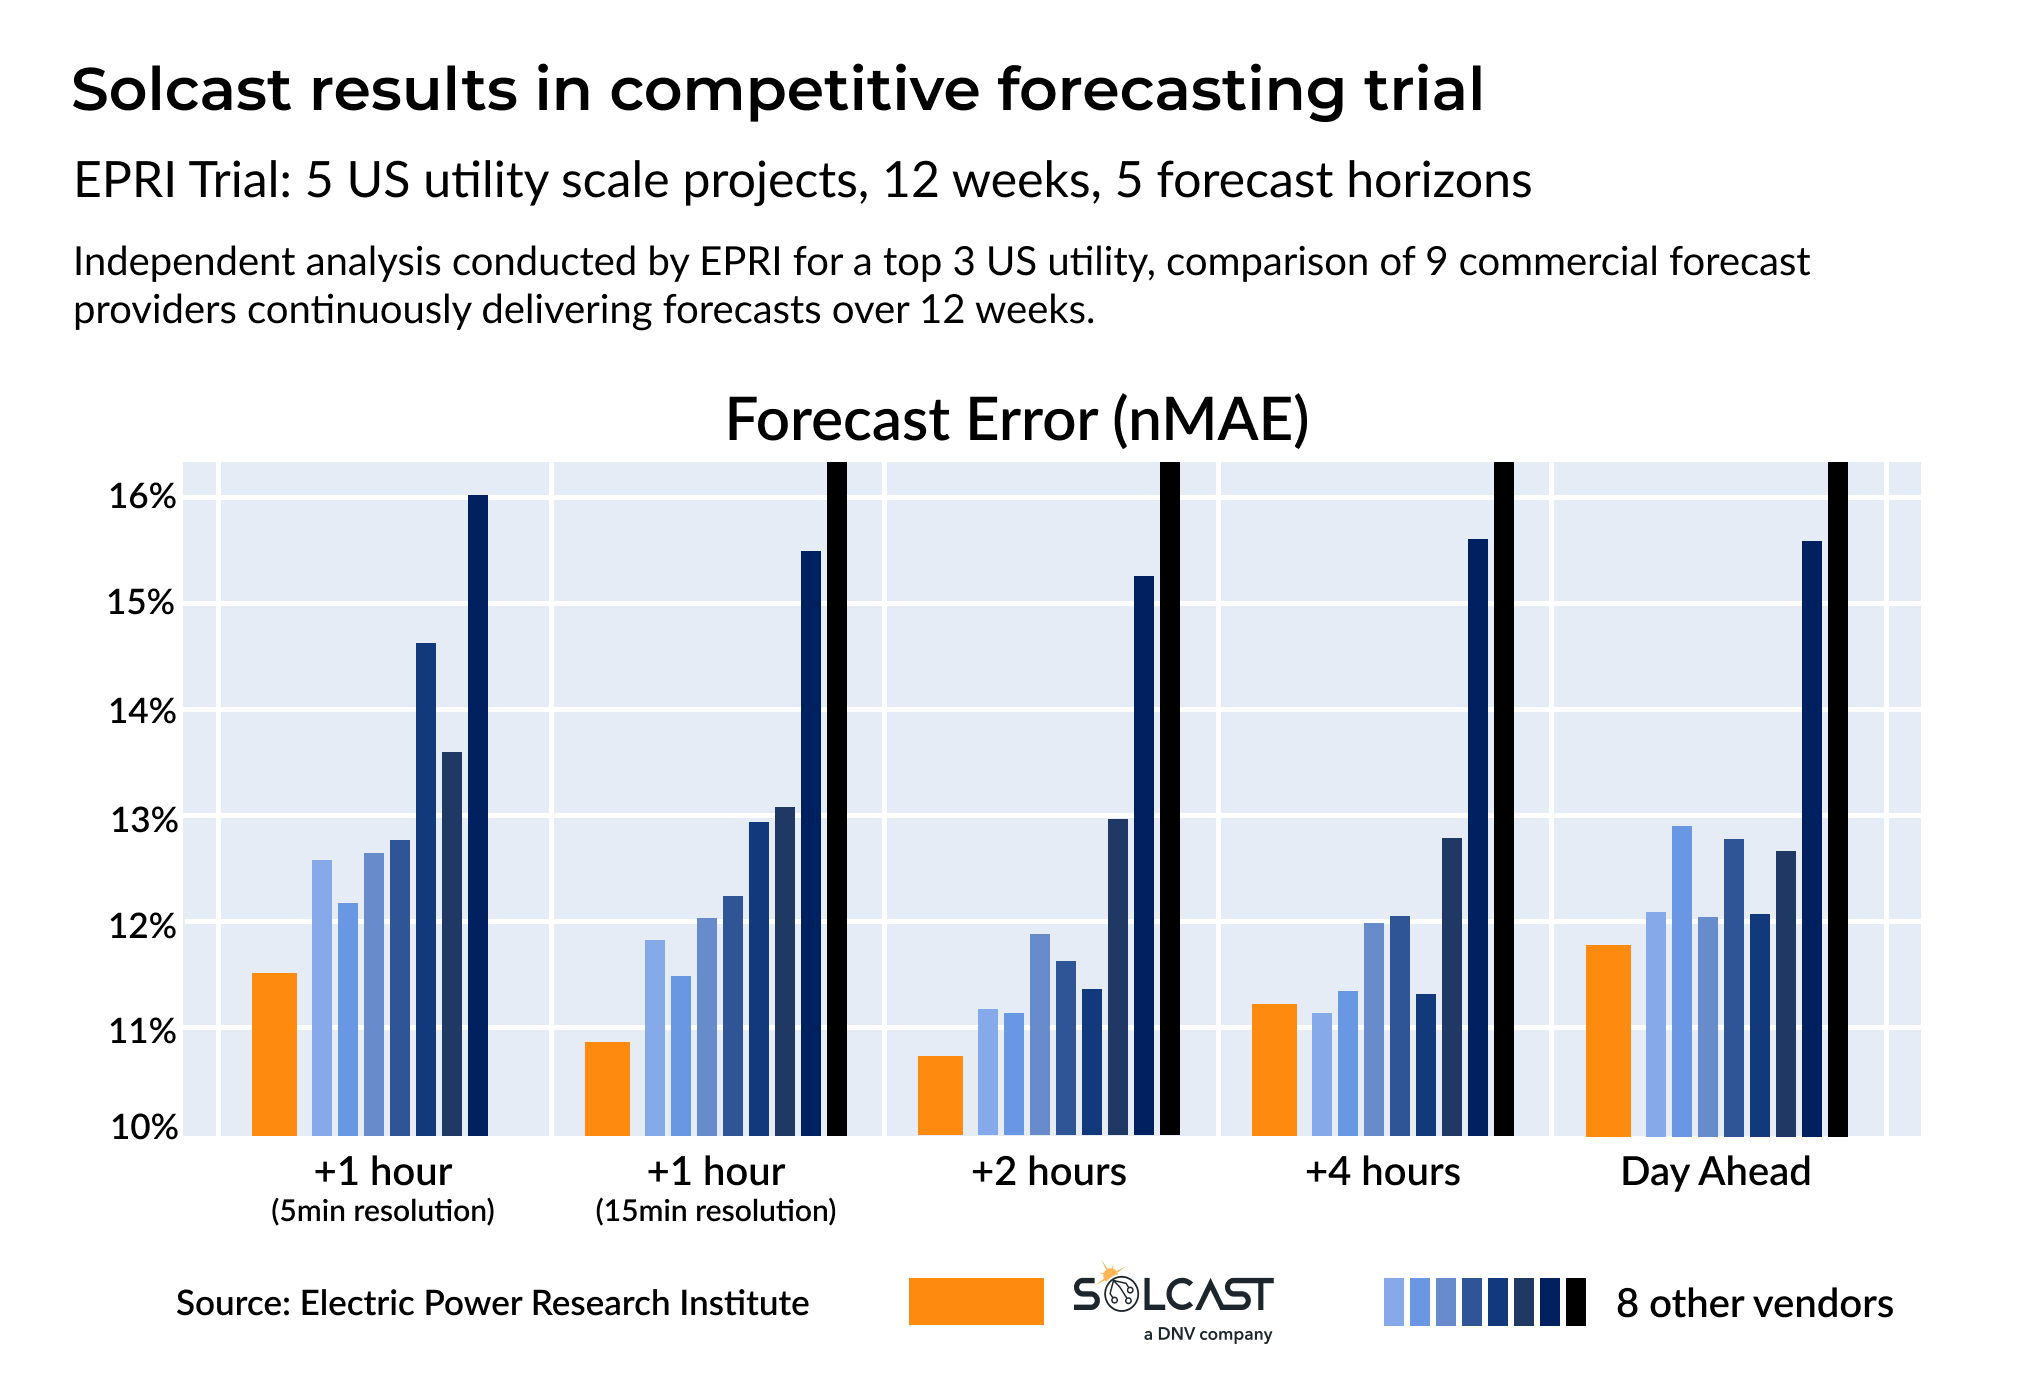
The Solcast modelling team used the Solcast API to deliver forecasts constantly through this 12 week study, updating each forecast using the latest data available. We are very proud to share that Solcast achieved the lowest forecast error overall, as well as the lowest error in 4 of the 5 forecast horizons.
Step 3: Review customer feedback, references and commercial applications
Customer feedback and references. See if the vendor gives case studies, references and feedback from its customers on its website, or ask the vendor for these. Give weight to details and comments that speak to performance, rather than just a list of customer logos.
The value of a forecast depends mostly on your use case and the marginal cost-benefit of if the forecast is more or less accurate. There are different thresholds for forecast risk if the downside is sub-optimal performance compared to if the downside is regulatory penalties for mis-forecasting generation for example. Consider reviewing available case studies, references or information about commercial applications of the data and how other businesses are using that forecast data.
Solcast data is used to the volume of 26 million API requests per day, across 65,000+ users spread across all continents, and with over 400 companies as enterprise clients, and we would be happy to explain the validation and assessment processes other customers have completed during their vendor selection process or provide customer references. You can also read DNV case studies about how Solcast data is being used by Wartsila Energy and GKN Hydrogen, who are both using Solcast data to actively optimise power management inside their respective BESS systems, delivering improved power management for their customers. Similarly Aurora Solar uses Solcast data to provide TMY and power production, for residential applications in their global platform.
After completing the above reviews, you may choose to complete your own validation process. If you are looking to take this step, our team has supported hundreds of commercial validations, and have shared the below process to make your results more accurate.
Performing your own validation study
Step 1: Refresh your understanding of the methodology you're assessing.
As mentioned above, you need to understand the methodology being used by each vendor so you can appropriately validate the accuracy of that method.
Depending on the time range you are interested in the primary mechanism, Solcast uses it to create forecast changes. For forecasts with less than 4 hours of lead time, referred to as nowcasts, Solcast uses satellite based forecasts, tracking and modelling cloud movement and changes (review the detail here). For lead times beyond this range then Solcast creates forecasts using an ensemble of Numerical Weather Prediction (NWP) models in combination with machine learning.
Step 2: Understand the scope of your assessment
Running a validation can be a significant commitment, so you should ensure that you design a validation study that provides the insights you need. These are the common points we see commercial operators consider if they choose to run their own studies:
- Sufficient duration. Variations in meteorological conditions make forecasting more and less easy. For example the average cloudiness between seasons may vary significantly. If you only have a short period of measurements available then you may not be able to assess what typical performance may be.
- Measurements at your location. There are two reasons we suggest on-site measurements are required. Firstly, forecasts are highly localised and measurements for a nearby location will not necessarily be well correlated with your target site. The other reason is that forecast quality varies with location as the specific meteorological conditions make some locations easier and harder. This means that using a nearby location may not give you an accurate indication of the operational forecast accuracy you receive.
- Quality assurance of measurements. As discussed in the previous article in this series, measurements are susceptible to quality issues and while some actions can be taken to mitigate these, it is difficult to fully resolve them. For example drifting calibration or the effects of soiling on a pyranometer can be insidious. This concern also applies to using power or energy numbers as there are a number non-meteorological conditions e.g. curtailment that restricts comparison with forecasts.
- Multiple Locations. As mentioned earlier the benefit of performing your own forecast trial is that specificity of the results for your site. The other side of this is that if you are interested in forecasts for multiple locations then the accuracy at one or even a few sites may not be representative of what you would observe across all your sites.
- Development and Analysis Resources. This is discussed in some more detail in the accessing Solcast Forecasts section but regardless of how you get forecasts, note that the analysis of forecast and comparison datasets takes work. However to help you with this we provide some resources which may be helpful:
- SDKs. We have Python, C# and Julia SDKs to help you fetch data from our API more quickly.
- The example Jupyter Notebooks included in our Python SDK are some examples using Jupyter notebooks of how to perform common analysis steps.
- SDKs. We have Python, C# and Julia SDKs to help you fetch data from our API more quickly.
For a more certain estimate of general forecast accuracy we suggest looking at the other validation pieces available at the start of this article. The analysis performed include the combination of multiple locations, long time periods, and high quality measurements, all of which are necessary to form an accurate picture of generalised performance.
Step 3: Assess the Vendor's Forecast data
It’s important that you have easy access to the forecast data you need to assess and measure. We cannot speak for how other vendors provide their data to you, but our team has built several easy ways to access our data, both for trial purposes and for live operational purposes.
There are two ways to get access to forecast data from Solcast:
Historic Forecast Extract. This is the fastest and easiest: typically you’ll get data within hours or days, and you’ll have results within days or weeks.
This entails Solcast extracting data for your locations with the parameters and forecast lead times that are of interest to you. Benefits are: data is already in a ready to compare format, duration of the comparison can be much longer which gives a better indication of average accuracy, and much less time before results. Issue frequency and lead time availability does have some limits, as due to the extra dimensionality this creates, not every forecast is possible to recreate.
Live Trial. This is slower and harder: typically requires minimum 3 months total elapsed time, and minimum 5 person-weeks of software development and analysis resources.
This is just querying Solcast’s API and saving the results. Compared with a historic forecast extract this method requires a lot more time, as it takes months to establish an accurate picture of forecast accuracy, and requires additional software development and data analysis resources to build an integration and to transform all the individual API queries to a dataset that is useable for comparison with measurements. However if you have no measurement history or have a very specific use case not covered by the available historical forecast data then it may be the right option for you.
Step 4: Define your trial parameters
As with any good scientific experiment we recommend that you specify your target criteria before conducting any analysis.
Regardless of whether you are assessing forecasts or actuals, one of the first things to specify is the primary metric you will be using to assess accuracy. Most commonly used are normalised Mean Absolute Error (nMAE) or normalised Root Mean Absolute Error (nRMSE) but there are plenty of other options such as bias or Critical Success Index (CSI). These are also explained in more detail in the previous article in this series.
For forecasts it is also particularly important to define what issue times, forecast lead times and temporal resolution (also known as period) you are interested in. Sometimes this may be dictated by local regulation e.g. hourly resolution forecasts for the next 24 hours to be submitted by 6pm every day or else your operational model may be the deciding factor. Defining these parameters to match the forecast that matters to you is essential to achieving a result that will help you choose a vendor. For example only assessing the accuracy of dayahead forecasts will not give you a good indication of the +1h forecasts and vice versa.
Step 5: Assessing Performance
As part of comparing past forecasts against other data sources there are a few steps that should be taken for an accurate assessment. These are common regardless of it you are comparing historic estimates or historic forecasts, so have been covered in our previous article, but can summarised as these three steps:
1. Aligning Timeseries
This ensures that each data point represents that same period.

2. Apply Quality Control
Remove corrupt periods that would result in inaccurate performance assessment.

3. Evaluating Forecast Quality.
Qualitative and quantitative assessment of the forecasts against actuals. As you can see, aligning the data and detailed quality control significantly changes the results of any quantitative assessment
Understand the difference between historical and forecast accuracy results
In contrast to historic estimates it is important to note that there will be differences in both qualitative and quantitative assessments of accuracy and that these differences will change with both forecast lead time and temporal resolution. In general, you can expect forecast accuracy to decrease as the lead time increases, as shown below this happens more rapidly in the first few hours and then the rate of change slows. For temporal resolution the accuracy will increase as the resolution decreases. This emphasises the importance of choosing a forecast horizon and resolution that are relevant to your use case.
Choosing the temporal resolution you are testing against is important, as it changes the accuracy you can expect. High temporal resolution data, like 5 minute data is able to capture the fine detail during morning and evening ramp periods, and the spikes in irradiance as clouds develop, approach and pass. This detail comes with a cost in accuracy however, as that detail is more difficult to resolve. 60 minute data captures less detail, but when compared to a 60 minute measurement, will have greater accuracy. The coarser resolution means the precise timing of cloud events are less significant and therefore easier to resolve.
Similarly selecting a forecast horizon is essential as average accuracy varies across time horizons. In part this is due to increasing uncertainty for larger horizons but there can also be differences due to changes in forecast methodology. For example, Solcast uses satellite derived cloud data for the first few hours of forecasts. This is done using recent and live satellite data to model the current position and recent movement of clouds, which is combined with data on aerosols and other weather inputs to estimate forecast irradiance. The modelling and tracking of cloud movements using satellite imagery is only currently able to predict out to a few hours with sufficient levels of accuracy. Beyond 4 hours, Solcast uses NWP based weather forecasts, which when combined produce relatively accurate forecasts, the best available, but not as accurate as a +1 hour cloud forecast based on live satellite data.
Combining these two factors will allow you to assess the level of accuracy you can expect for your use case. A +1 hour forecast at 60 minute resolution should be very accurate. A +24 hours forecast at 5 minute resolution is possible, but will see higher error due to the fine resolution and longer time horizon.
Note: Assessing Accuracy Using GTI or PV Power
When planning on using GTI or power generation for assessing forecast accuracy make sure the provided site specifications match with the location’s. Information such as whether the site is tracking or fixed tilt, or the panel or array’s azimuth and tilt are key. If this information does not match then your metrics will not give an accurate indication of the forecast accuracy. If unsure of the specifics of your sites then it may be better to assess using another parameter like GHI instead.
As mentioned earlier, using PV power to assess accuracy is difficult, because there are several non-meteorological factors that can make comparison between forecasts and actuals more difficult. We will shortly be publishing an article on how to assess the accuracy of a PV power model, which can help with this assessment.
Missed the start? Read Evaluating accuracy I: Satellite-derived irradiance data. Or continue to Evaluating accuracy III: PV power data