


Dr. Hugh Cutcher
September 4, 2024
Share this post
Unstable polar vortex conditions and persistent high-pressure systems led to a season of weather extremes across Australia in July and August, resulting in both record-breaking cold and heat. These dynamic weather patterns brought mixed impacts on solar irradiance, with significant variations between different regions.
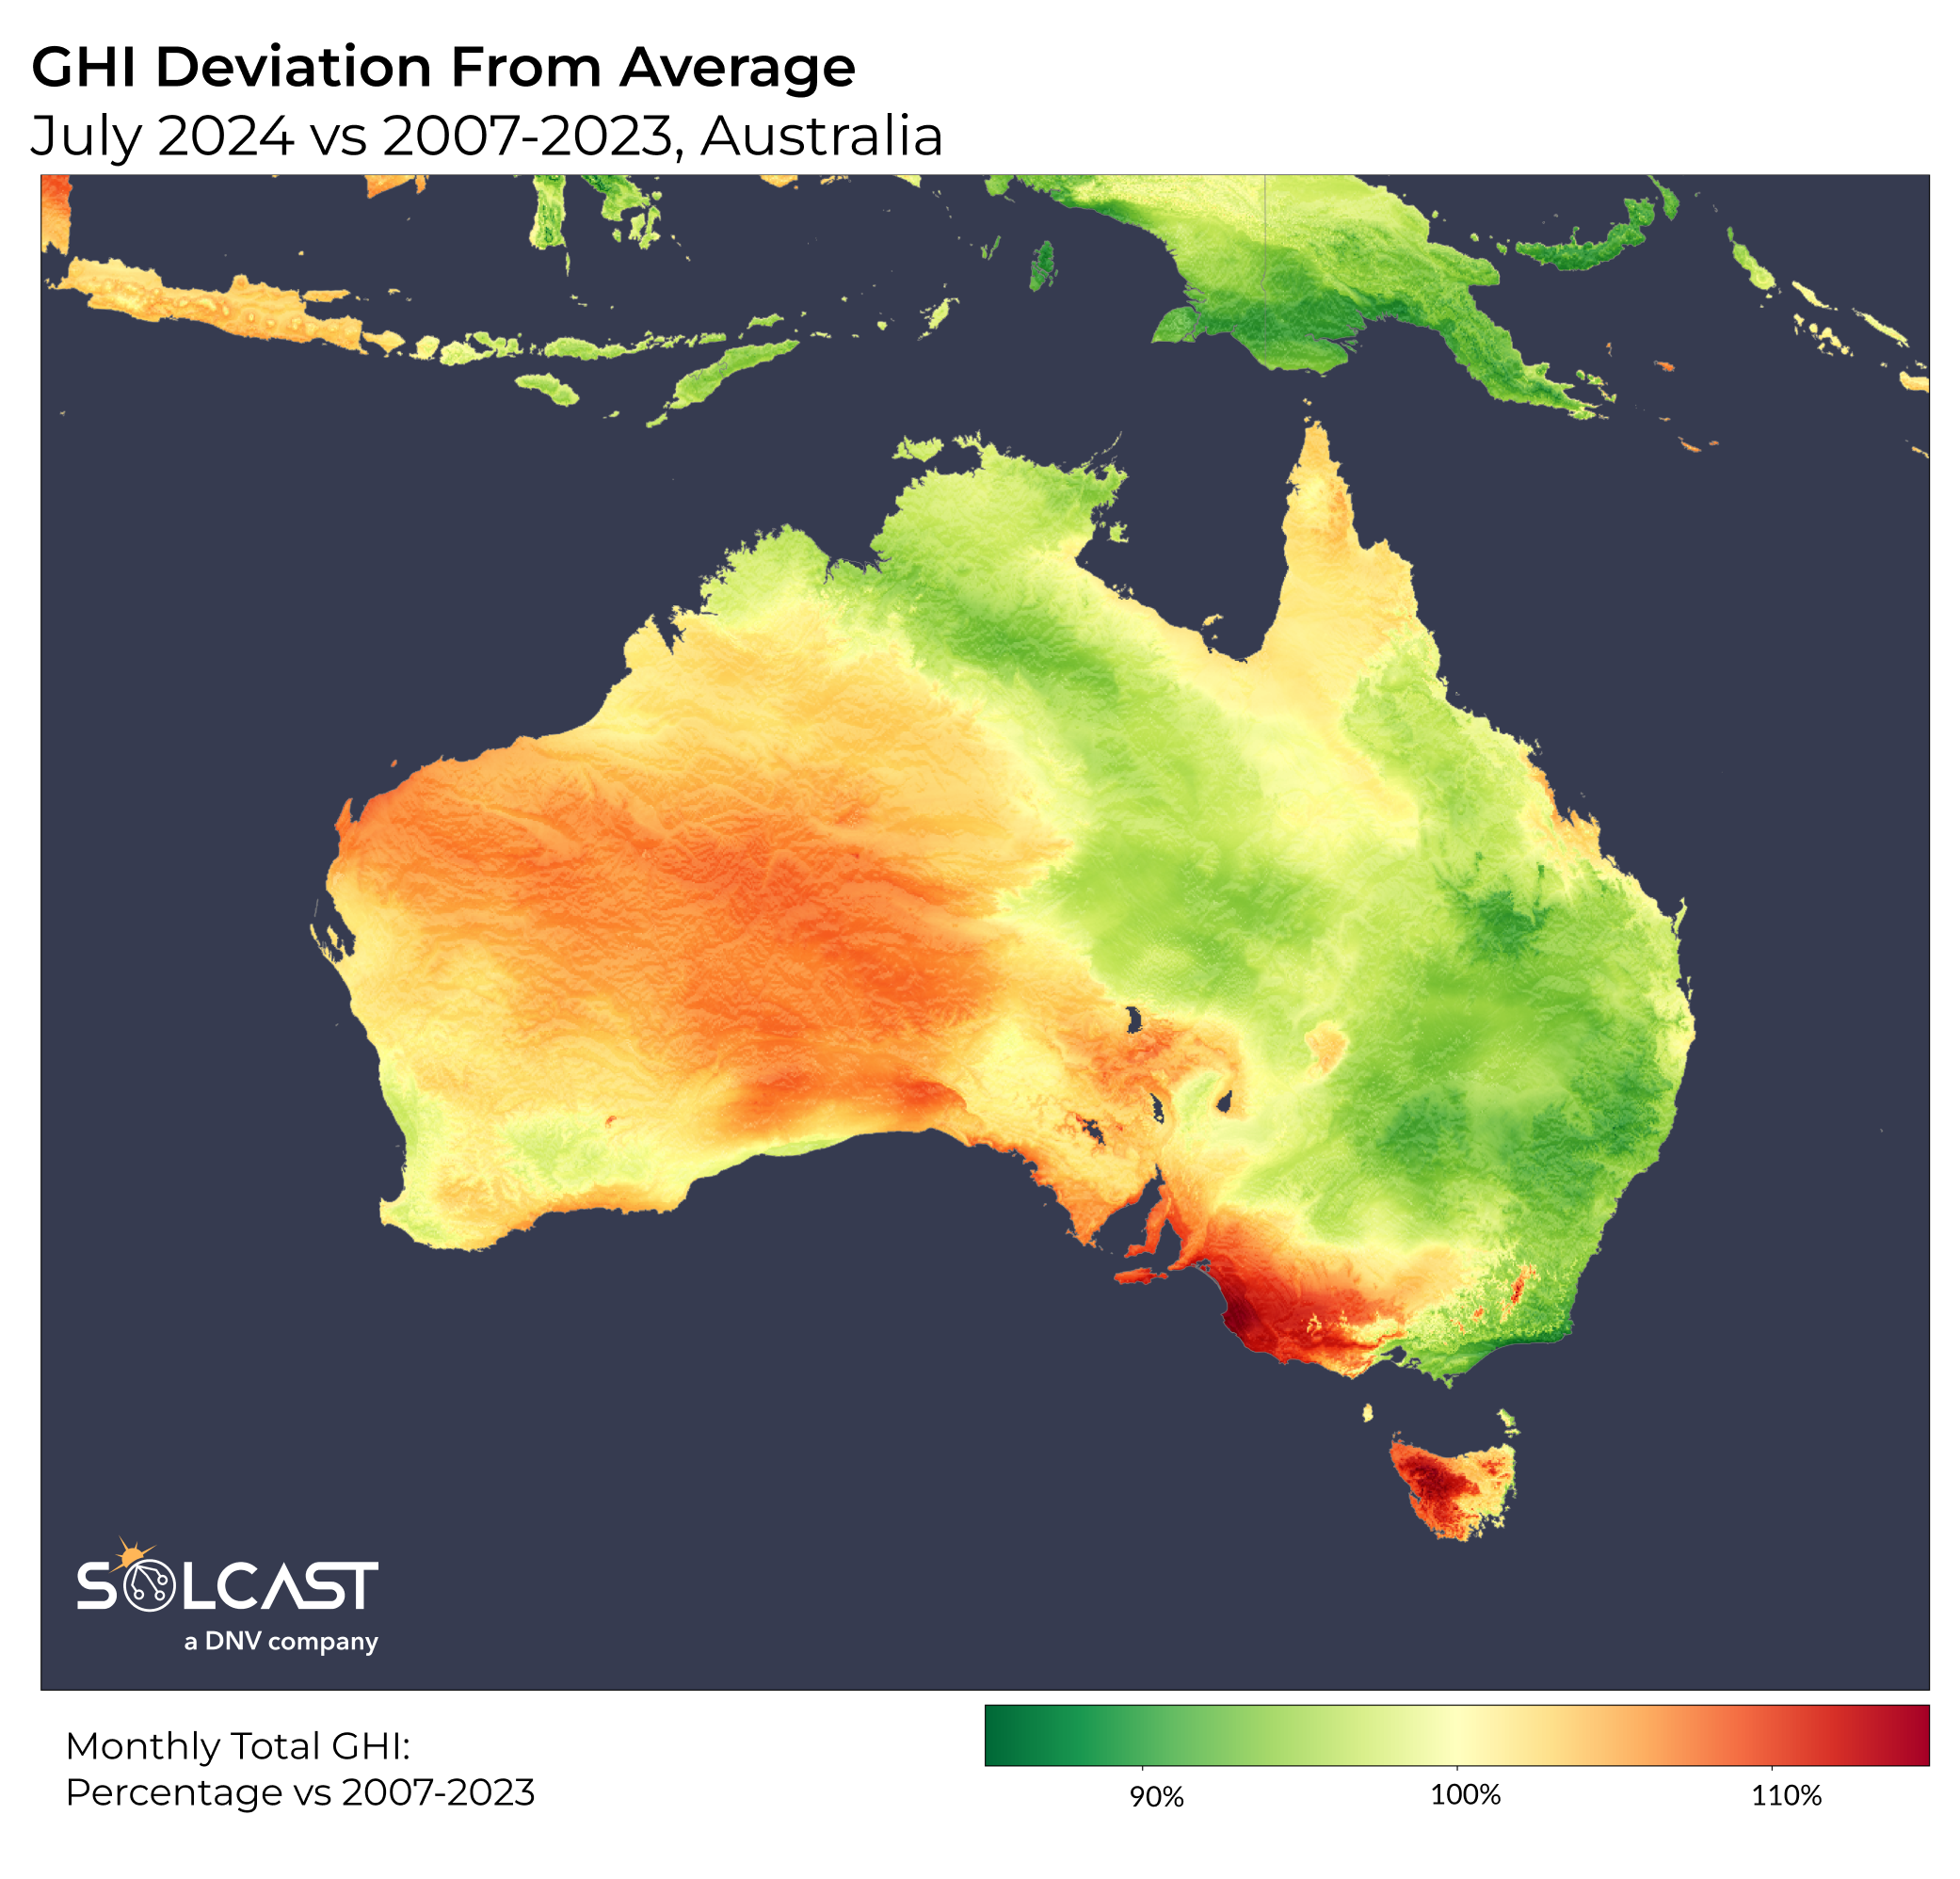
July was a challenging month for solar in most of the National Energy Market (NEM), as much of Australia’s population, concentrated on the east coast, experienced cloudier-than-usual conditions. This resulted in all but two states, Tasmania and South Australia having lower normalised behind-the-meter PV generation than typical for July. Even Western Australia saw less generation due to concentration of installed capacity around Perth which saw below average irradiance. Almost all areas in Queensland reported lower-than-average irradiance, with reductions of up to 10% in some regions. In contrast, the western half of Australia enjoyed higher-than-average irradiance, marking a clear East-West divide. The disparity is due to a near-record high-pressure system off the coast of Tasmania, which brought record-breaking cold to southeastern Australia at the beginning of the month. This cold spell was soon followed by a series of rain bands that further reduced irradiance across much of the NEM.
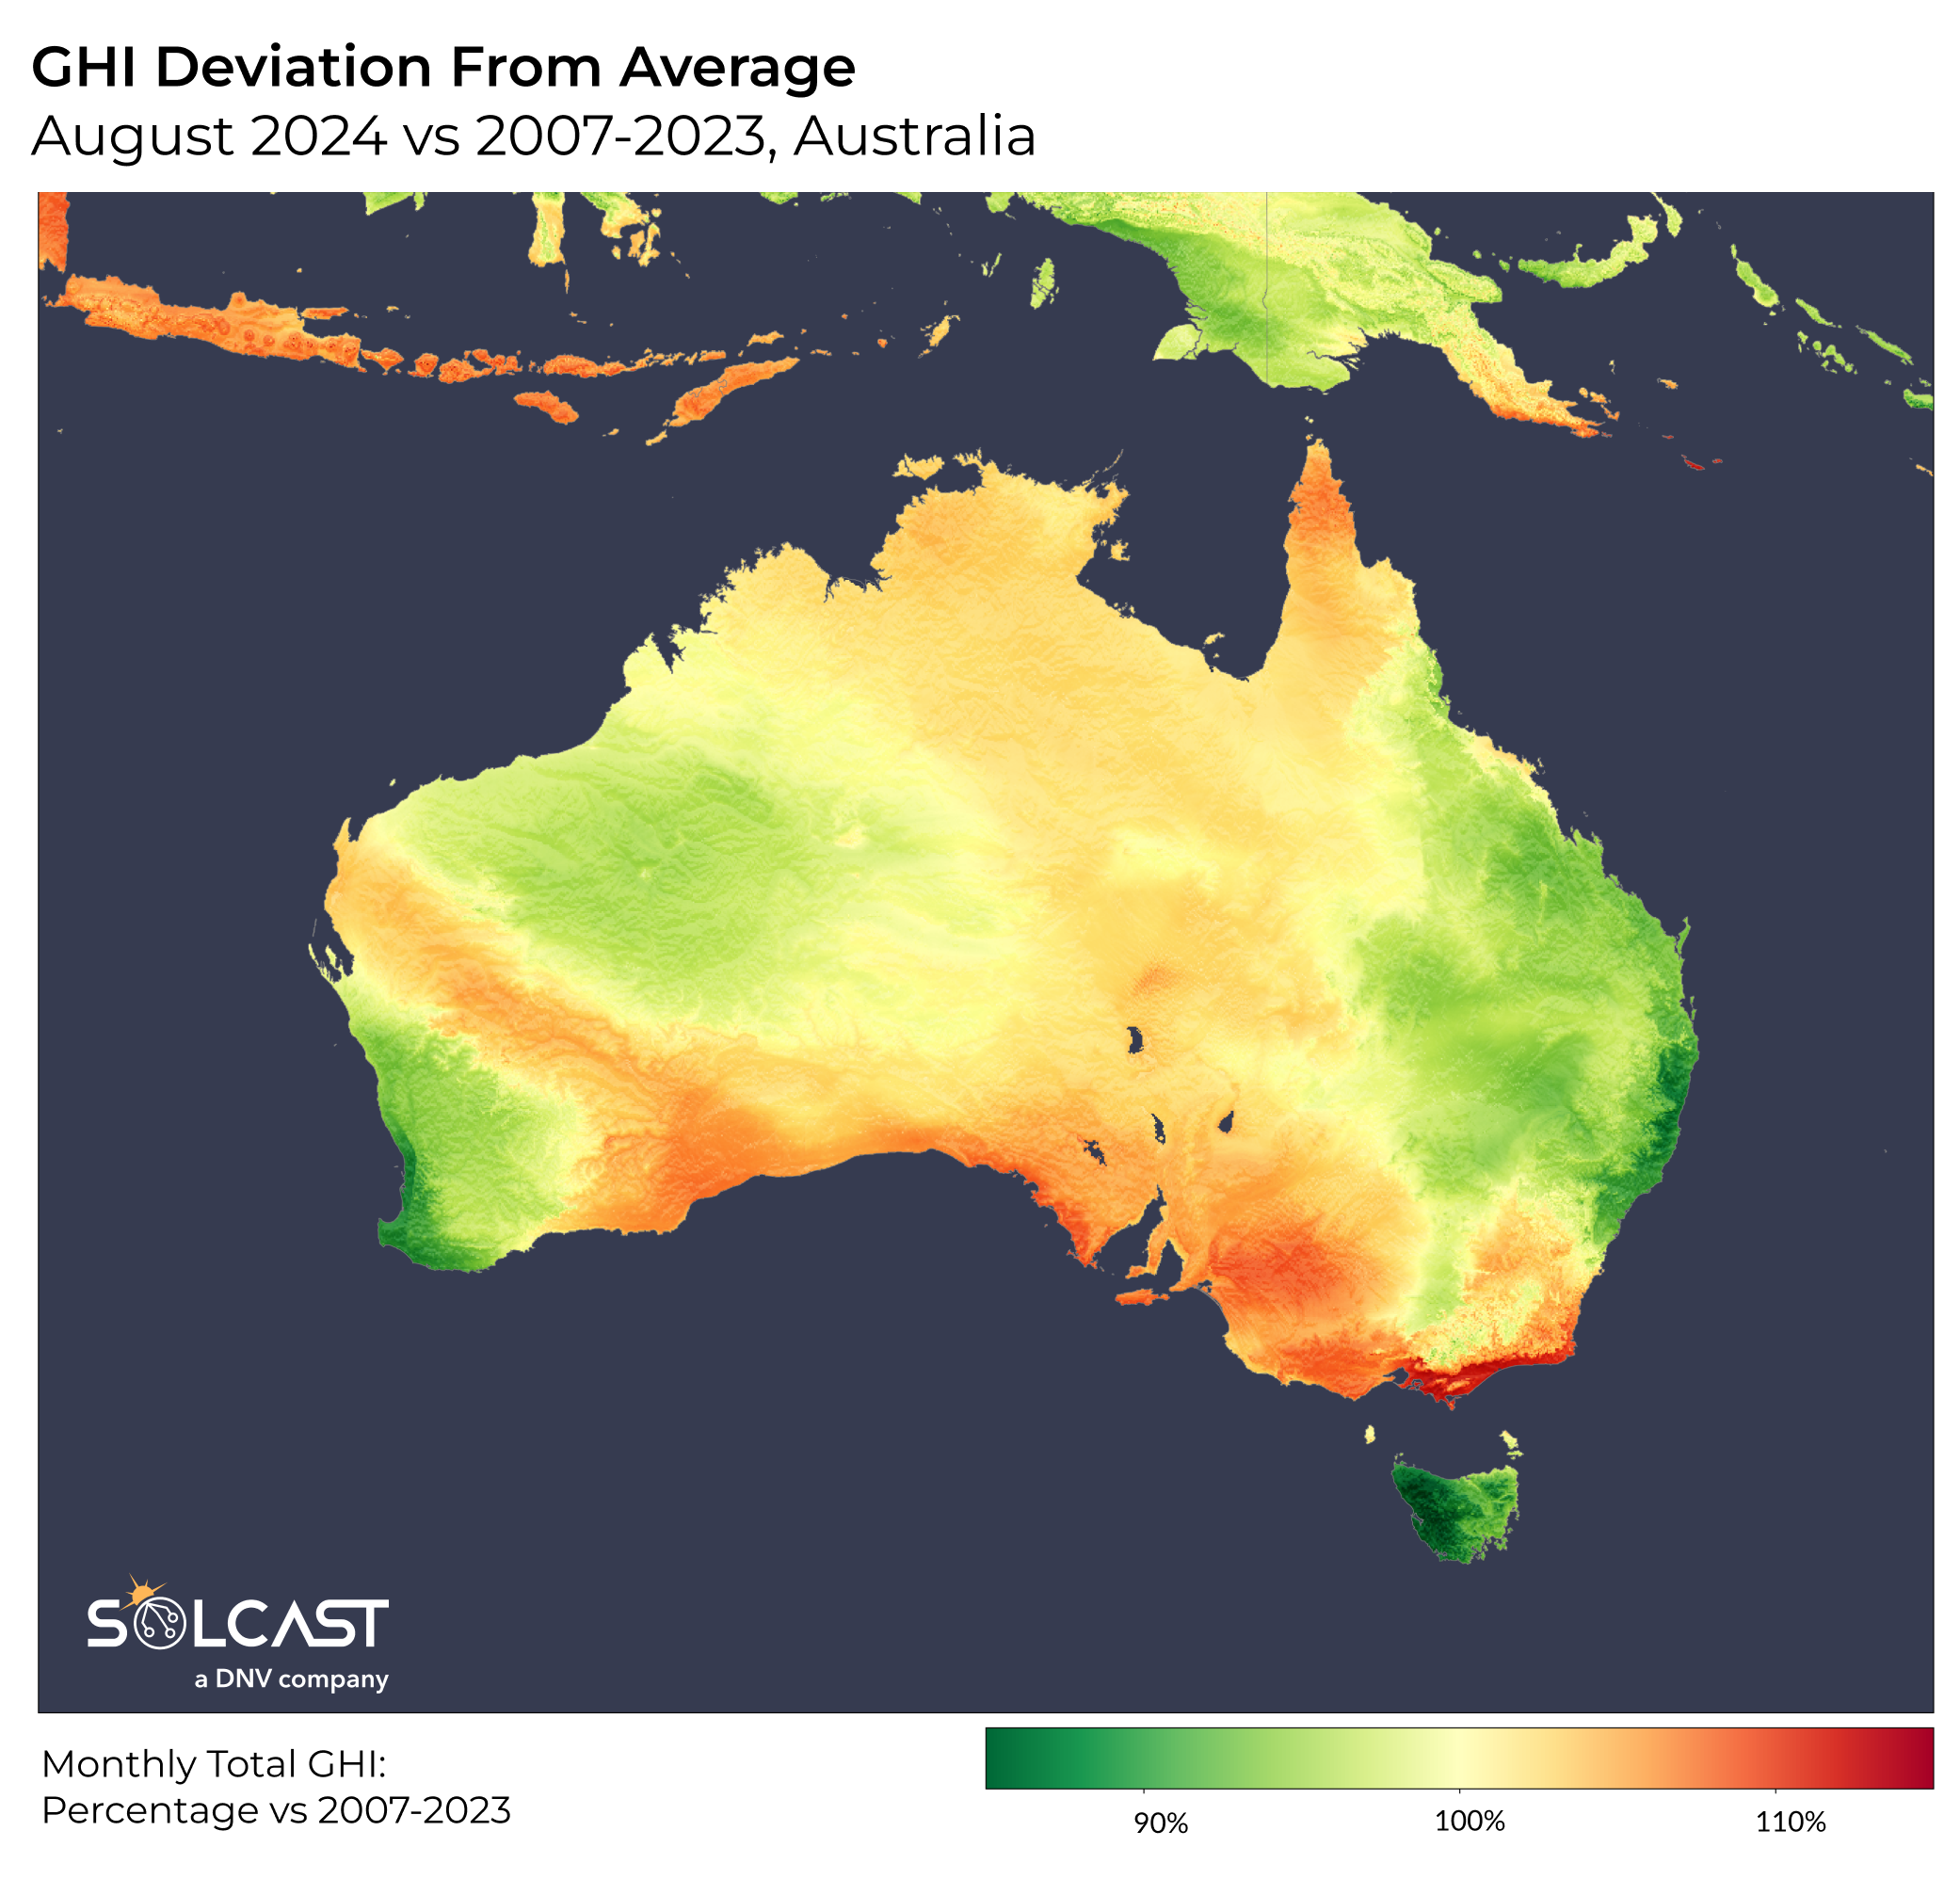
August presented a more mixed result, with varying weather patterns across the country. Queensland, New South Wales, Tasmania, and parts of Western Australia experienced increased cloud cover and rainfall, which dampened solar irradiance. However, the month ended with an extraordinary spike in temperatures, setting new winter records over 40 degrees celsius in many areas. This was driven by a high-pressure system over eastern Australia and the Tasman Sea, which cleared skies and brought warmer northerly winds. Despite this late surge in temperatures and clearer skies, the earlier wet weather on the East Coast meant that overall irradiance remained subdued.
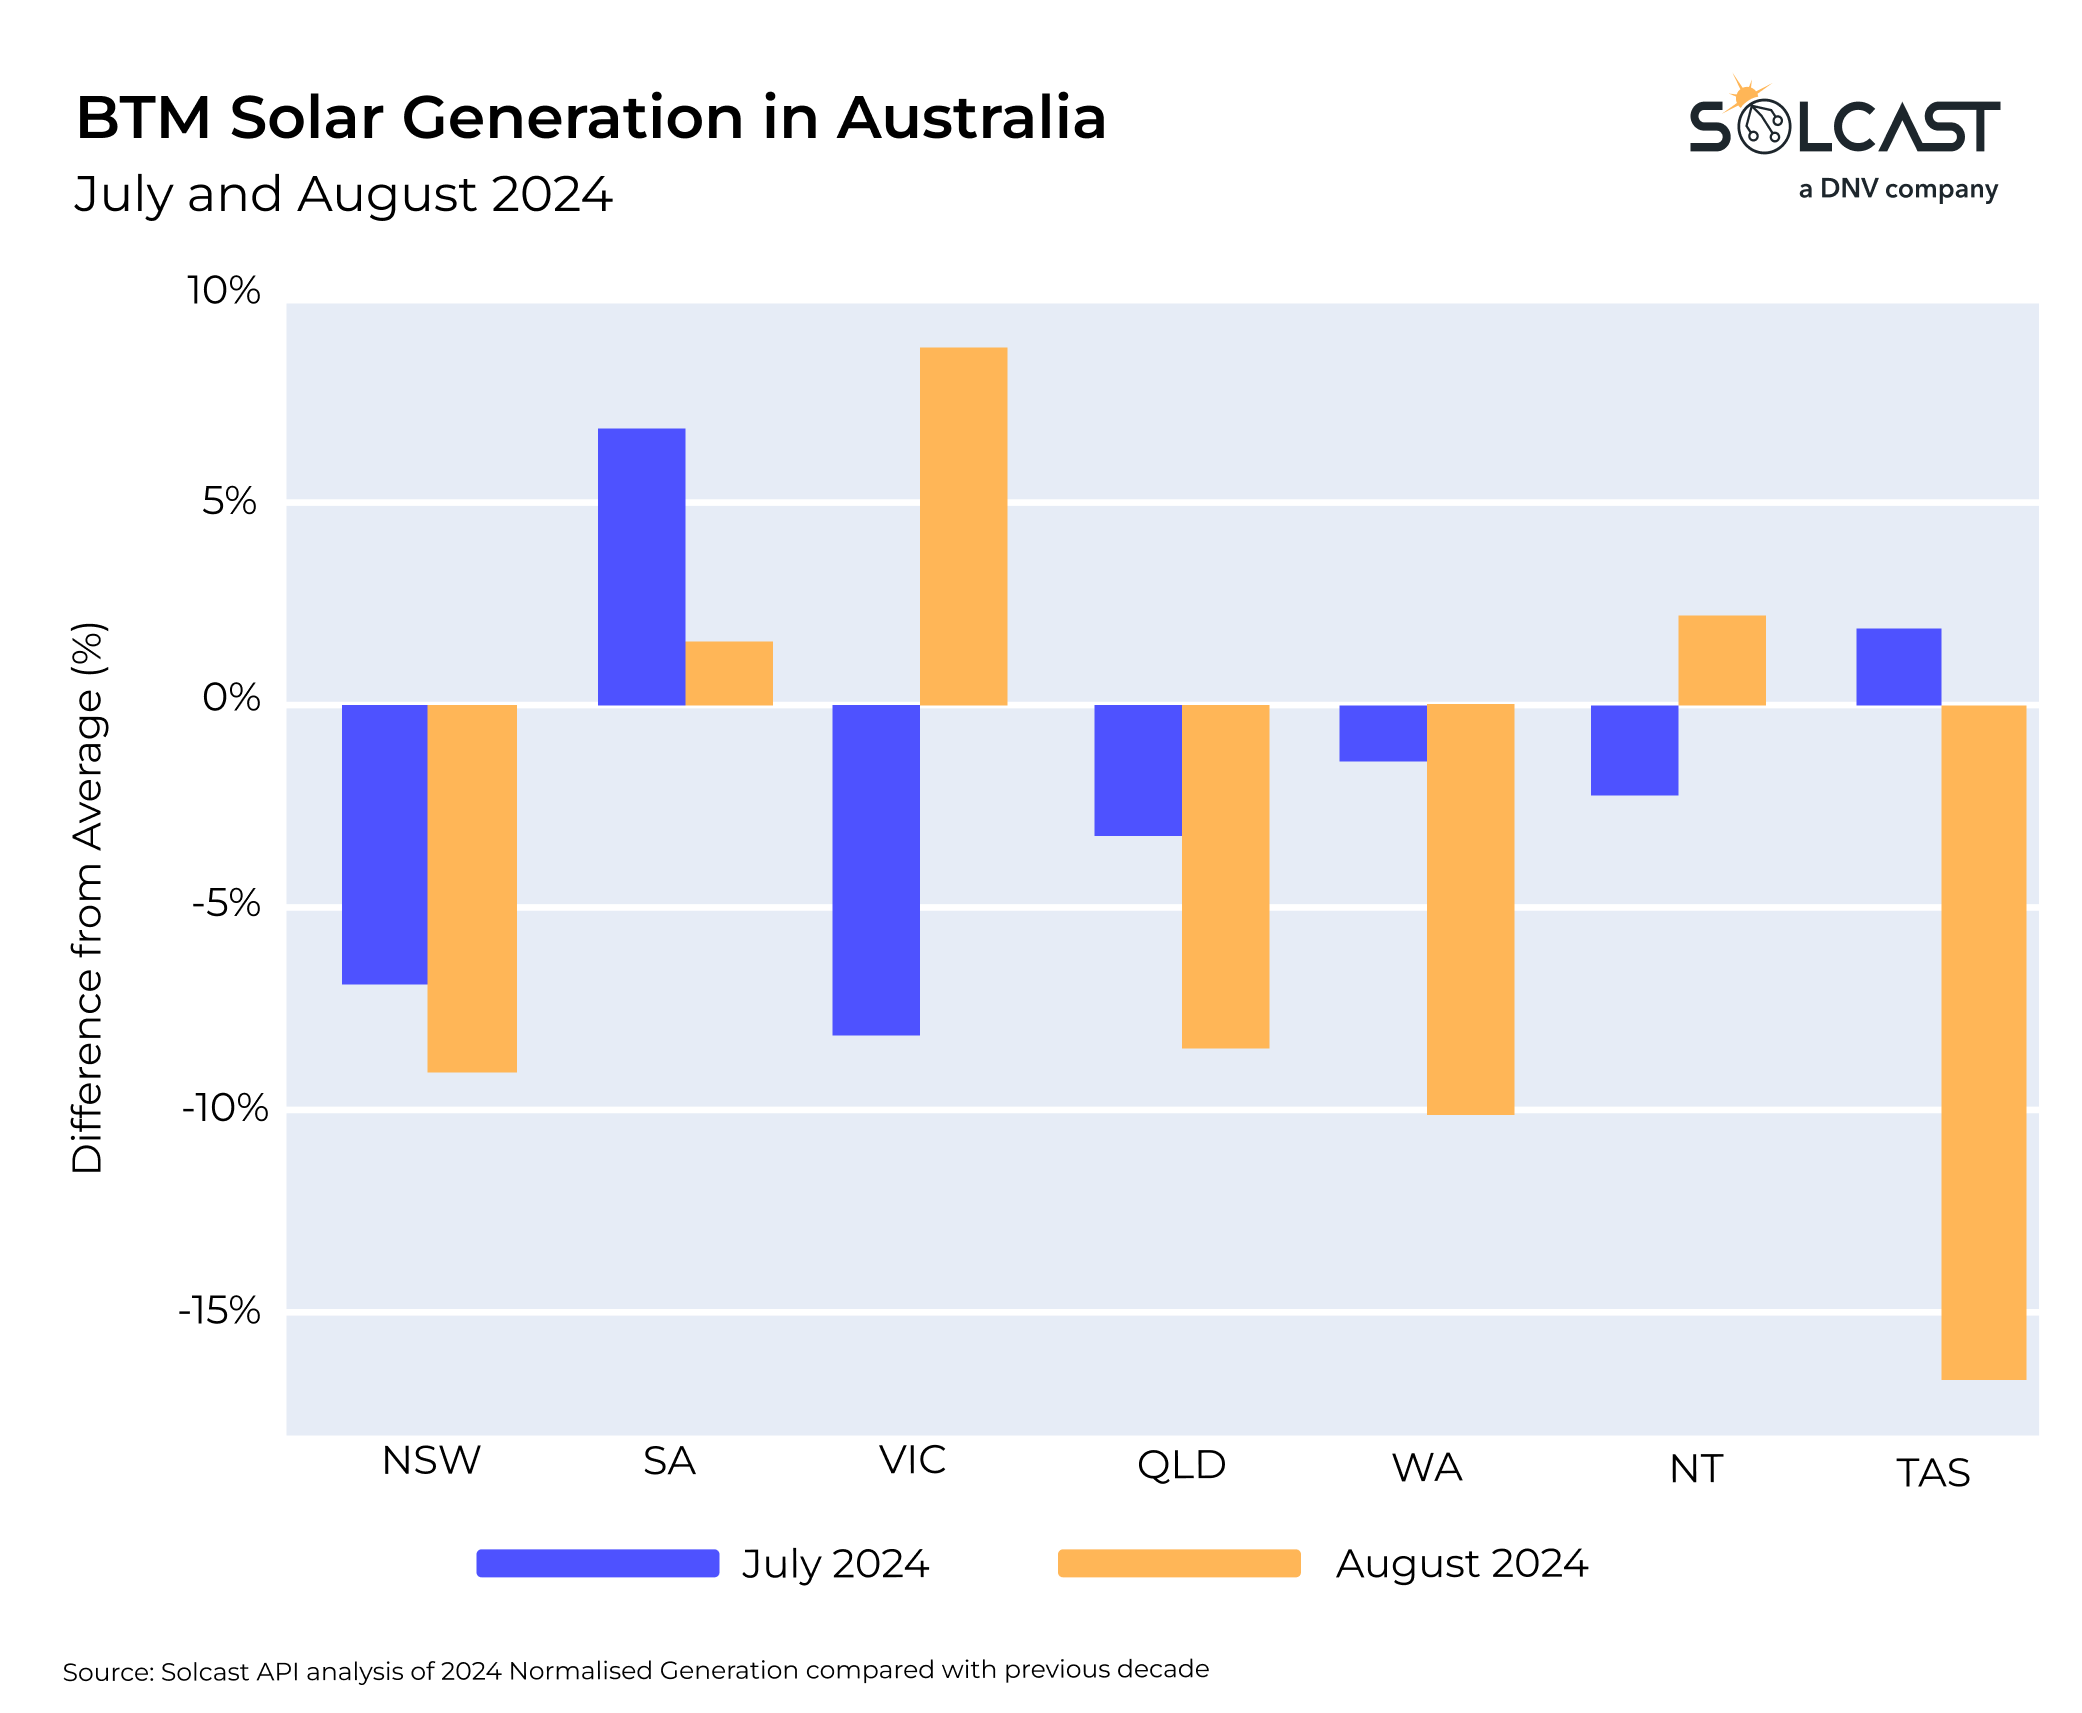
Victoria and Northern Territory had a change in fortune from July with greater PV generation than the average August, joining South Australia as the only states to see a boost. Tasmania saw its lowest normalised generation in the last decade with the whole state seeing lower irradiance.
The pattern of above-average rainfall is expected to persist into the latter part of the year. The Australian Bureau of Meteorology (BOM) is forecasting higher chances of rain for most of central and eastern Australia, which could continue to affect solar irradiance in these regions.
Track weather conditions, cloud movements, and irradiance-influencing factors that impact your solar generation. Access bankable actuals and accurate forecasts when you sign up for a Solcast API toolkit. You can reach out to our team for an extended trial.