


Dr. Hugh Cutcher
February 11, 2026
Share this post
Most of Australia recorded above average irradiance in January 2026 as a hot, dry continental airmass dominated the month, despite localized reductions from bushfire smoke, dust, and an active monsoon in the tropical north, according to analysis using the Solcast API. While widespread sunshine supported strong conditions for PV generation, elevated temperatures, smoke events, and dust soiling created operational challenges. In contrast, northern Queensland and far north of Australia experienced significant irradiance deficits under persistent monsoonal cloud and Tropical Cyclone Koji.
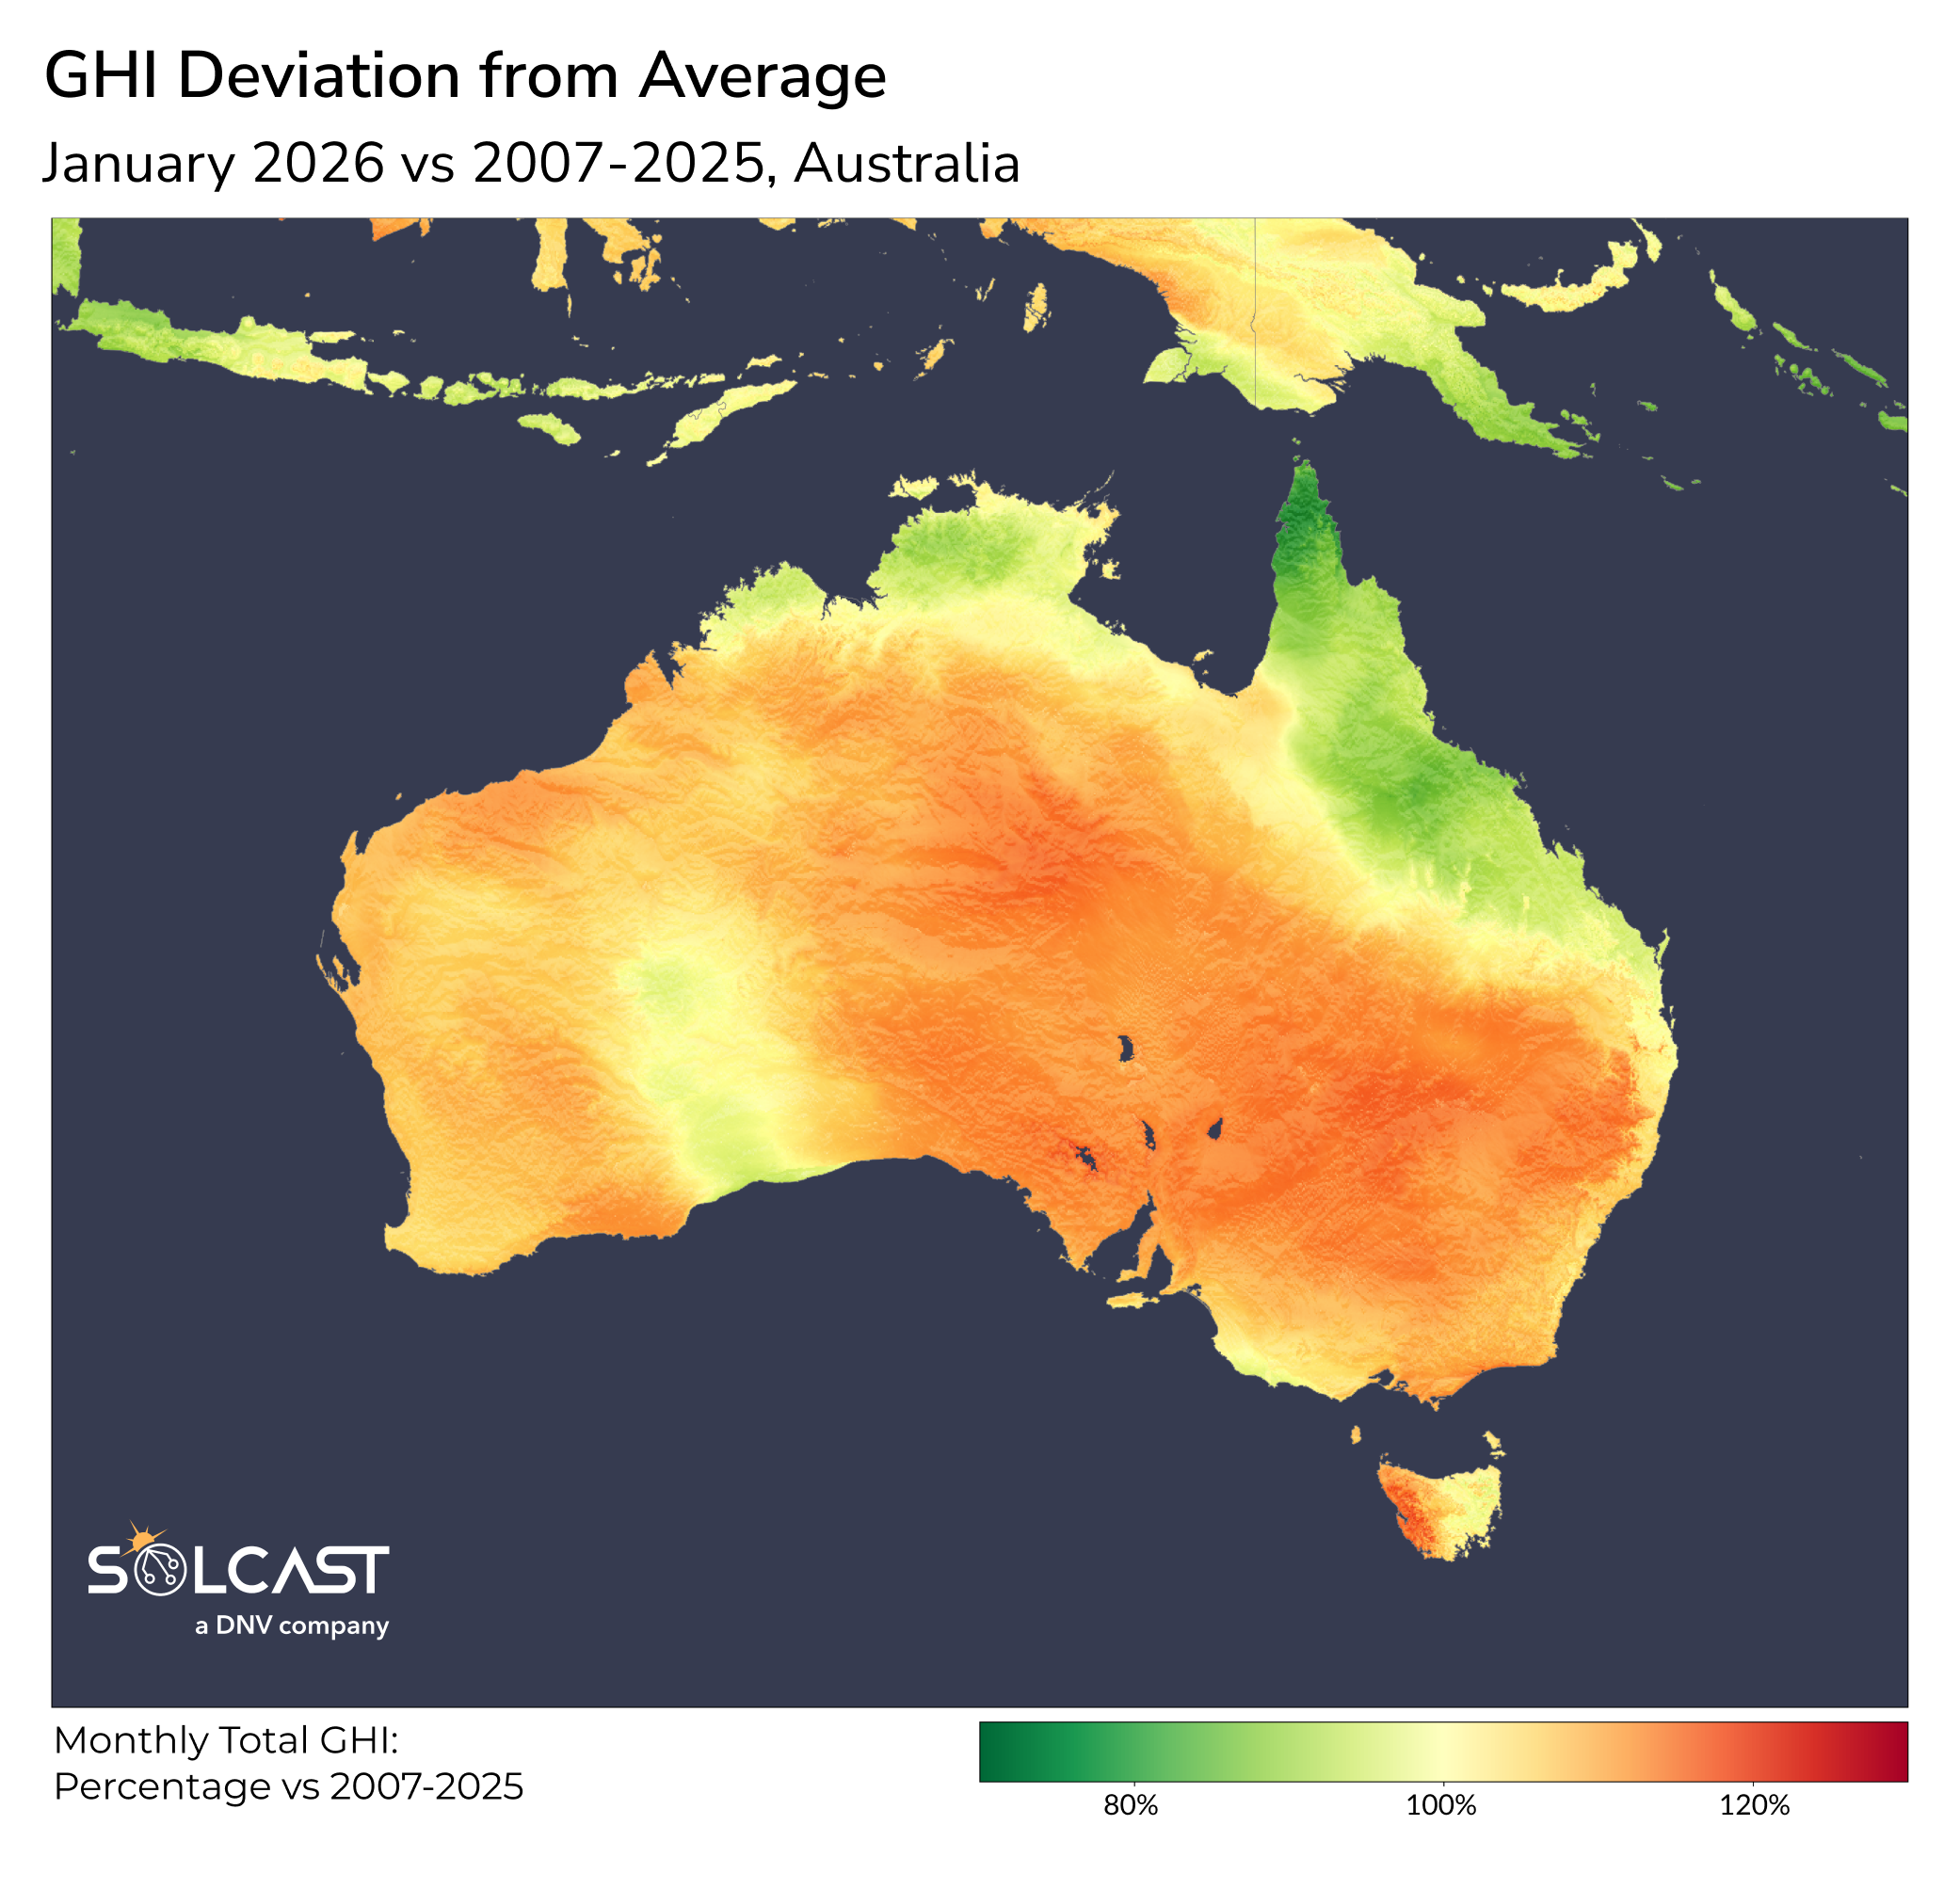
Dry conditions prevailed across the majority of the continent, lifting monthly average irradiance 10% to 15% above the January climatology, particularly across inland New South Wales, Queensland, South Australia, and Western Australia. These clear-sky conditions were associated with a slow-moving upper-level pattern that supported the development of a persistent heat dome over the continent. This feature suppressed cloud formation and rainfall, while periodically directing hot northerly winds into southeastern Australia ahead of cold fronts. Nationally, monthly average temperatures were 2.3 C above normal, exceeding 3 C above average in parts of interior New South Wales and southwest Queensland. While clear skies favoured irradiance, module operating temperatures would have been elevated, reducing panel efficiency during peak heat periods. The scale of the above-average warmth is consistent with broader trends observed in a warming climate.
The hot and dry pattern also heightened bushfire risk and dust mobilisation, creating additional complexity for PV operations. Strong northerly winds preceding southern cold fronts drove dangerous fire weather in Victoria and New South Wales, with smoke temporarily reducing irradiance at nearby sites. In Bendigo, analysis of particulate matter concentrations and rainfall indicates a noticeable uptick in estimated soiling losses around 11 January, coinciding with nearby fire activity. Subsequent rainfall helped wash panels clean, limiting the persistence of these losses. Although fire episodes reduced irradiance locally and temporarily, they did not materially alter the overall monthly above-average signal, as similar events appear in the historical January baseline.
Further inland, prolonged dryness enabled dust uplift. In Alice Springs, elevated PM10 concentrations on 12 and 13 January were associated with a marked rise in estimated soiling losses. With minimal rainfall to offset accumulation, losses increased from 0.024 to 0.032 over the month, equivalent to around 0.8% additional reduction due to dust deposition. A large dust storm late in the month, moving into western New South Wales, underscored the vulnerability of central Australian sites during extended dry spells.

In contrast to the national trend, tropical regions saw substantial irradiance deficits. Cape York Peninsula recorded values around 20% below average, while the far north of Australia and parts of northeast Queensland near Townsville and Mackay were approximately 10% below normal. A persistent monsoon trough brought widespread cloud and rainfall across northern Australia. Tropical Cyclone Koji, named on 10 January in the Coral Sea, further reduced irradiance as thick cloud covered coastal Queensland between Townsville and Mackay. As the system weakened inland, heavy rainfall and flooding followed, with more than 22,000 homes experiencing power outages due to wind and rain damage.
Track weather conditions, cloud movements, and irradiance-influencing factors that might impact your solar generation. Access bankable actuals and accurate forecasts when you sign up for a Solcast API toolkit. You can reach out to our team for an extended trial.