


Dr. Hugh Cutcher
January 13, 2026
Share this post
December’s solar resource across North America reflected a classic La Niña pattern, as demonstrated in this analysis using the Solcast API. A persistent subtropical ridge over the southwestern United States suppressed solar generation across the Pacific Northwest and western Canada, whilst driving above-normal conditions from the Southwest through the Great Plains. This blocking configuration diverted storm tracks northward while allowing dry subtropical air to dominate much of the southern tier.
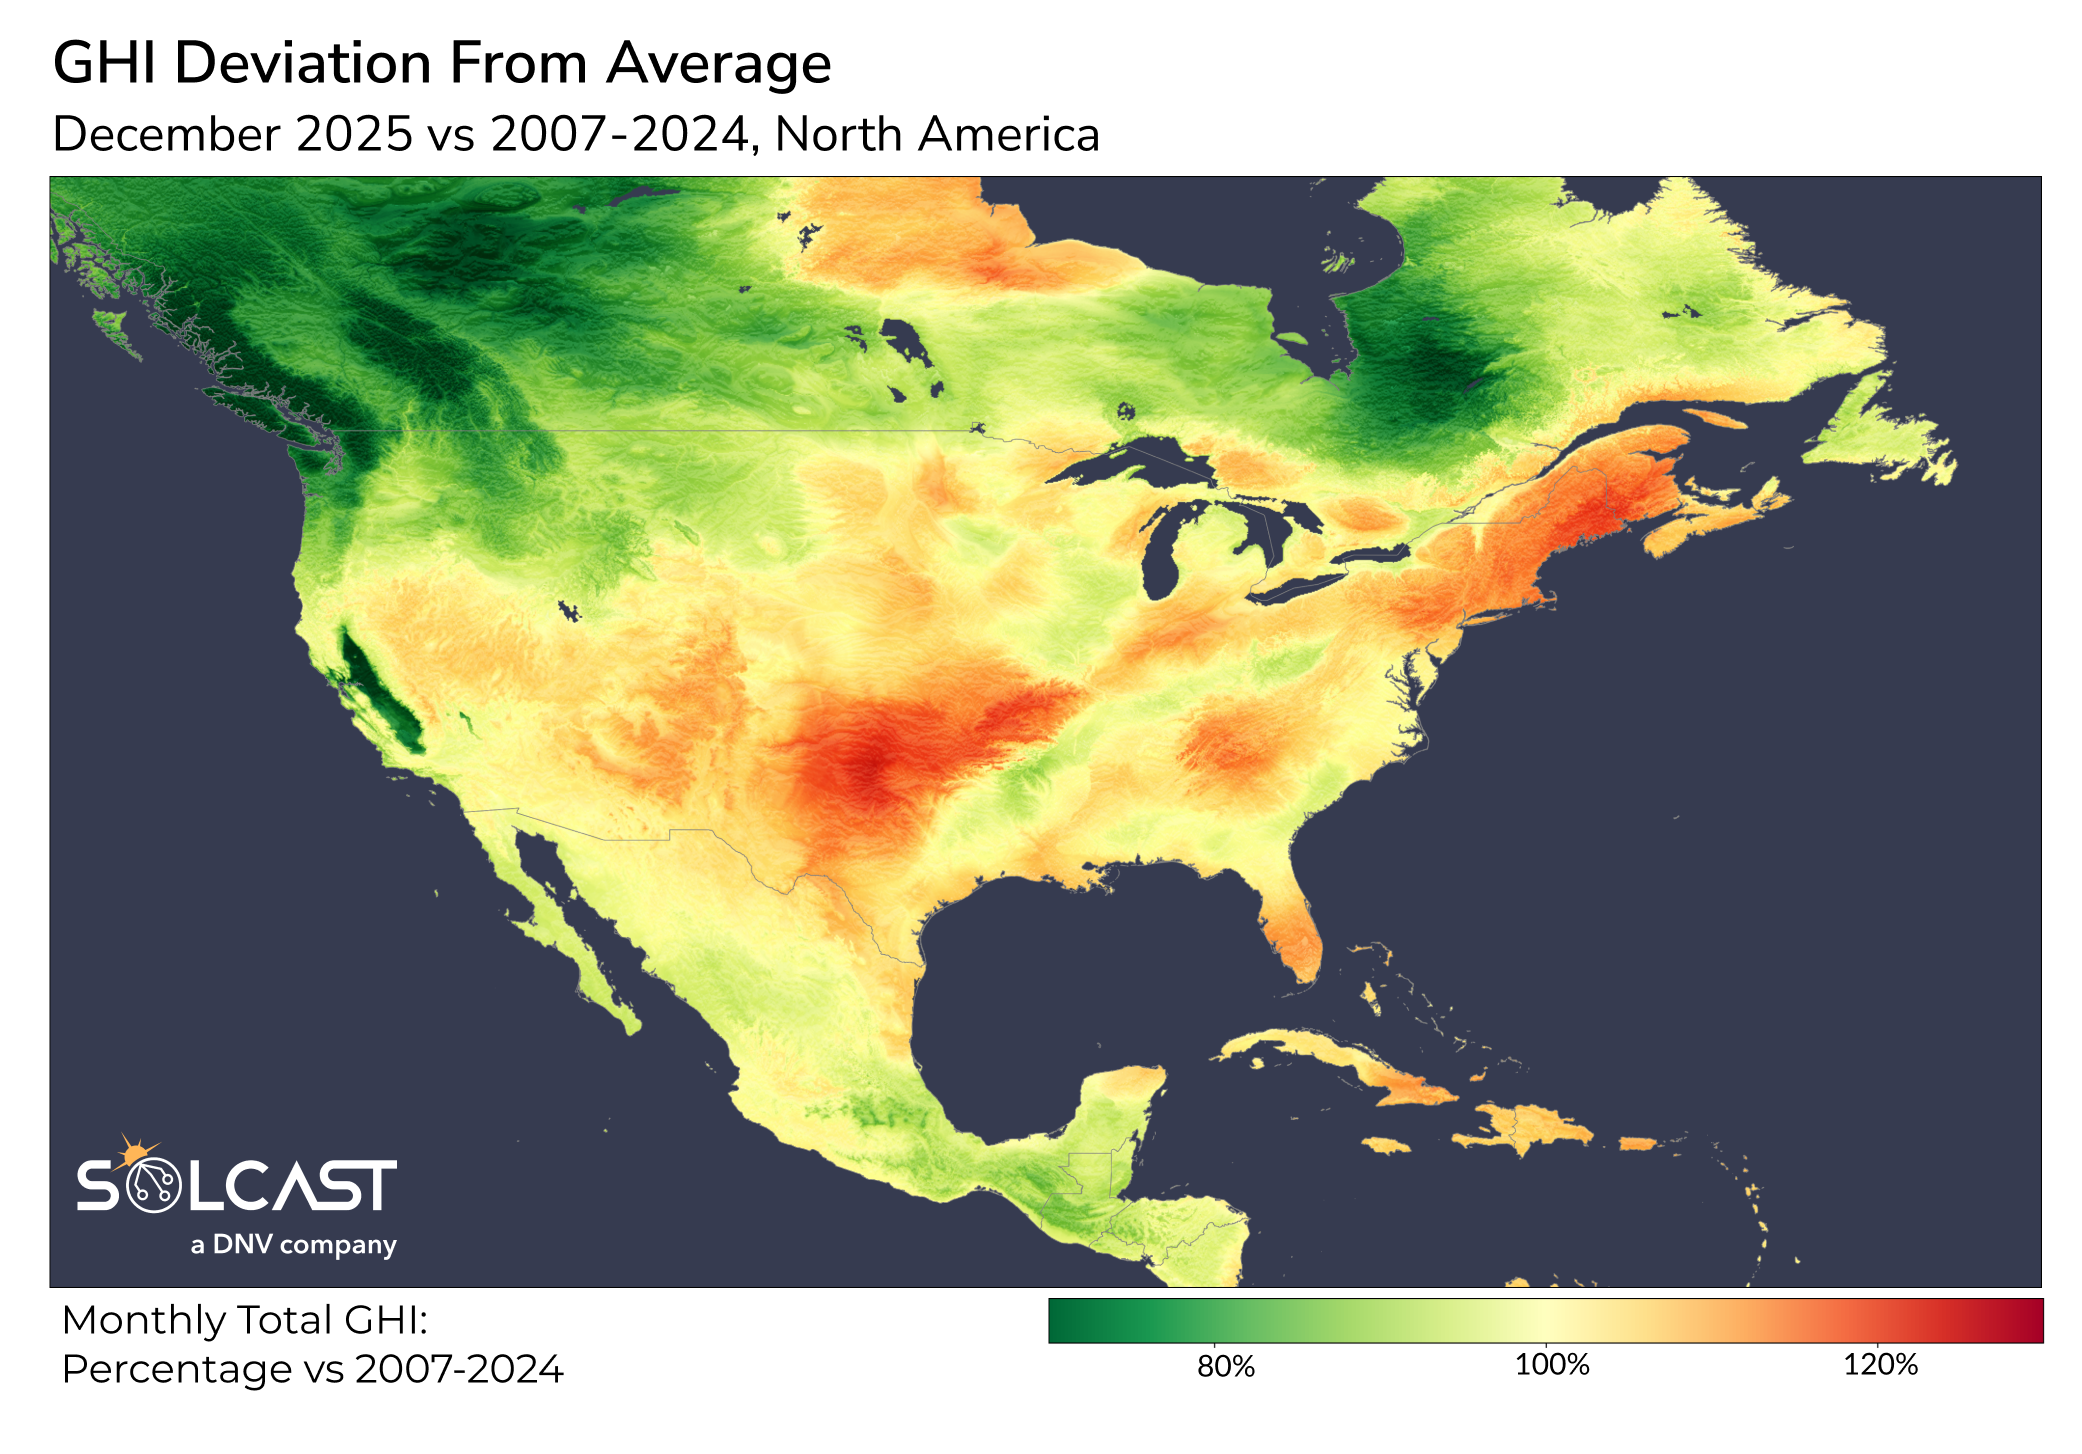
The first driver was a strong ridge anchored over the Southwest, which acted as a blocking high. This feature forced the Pacific jet stream north into British Columbia and Alberta, steering storm systems away from the U.S. West Coast. As a result, the Pacific Northwest and western Canada recorded irradiance 20% to 30% below normal, consistent with frequent cloud cover and moisture-laden air. Baja California and northern Mexico also saw slightly below-normal values, as subtropical moisture occasionally intruded along the southern fringe.

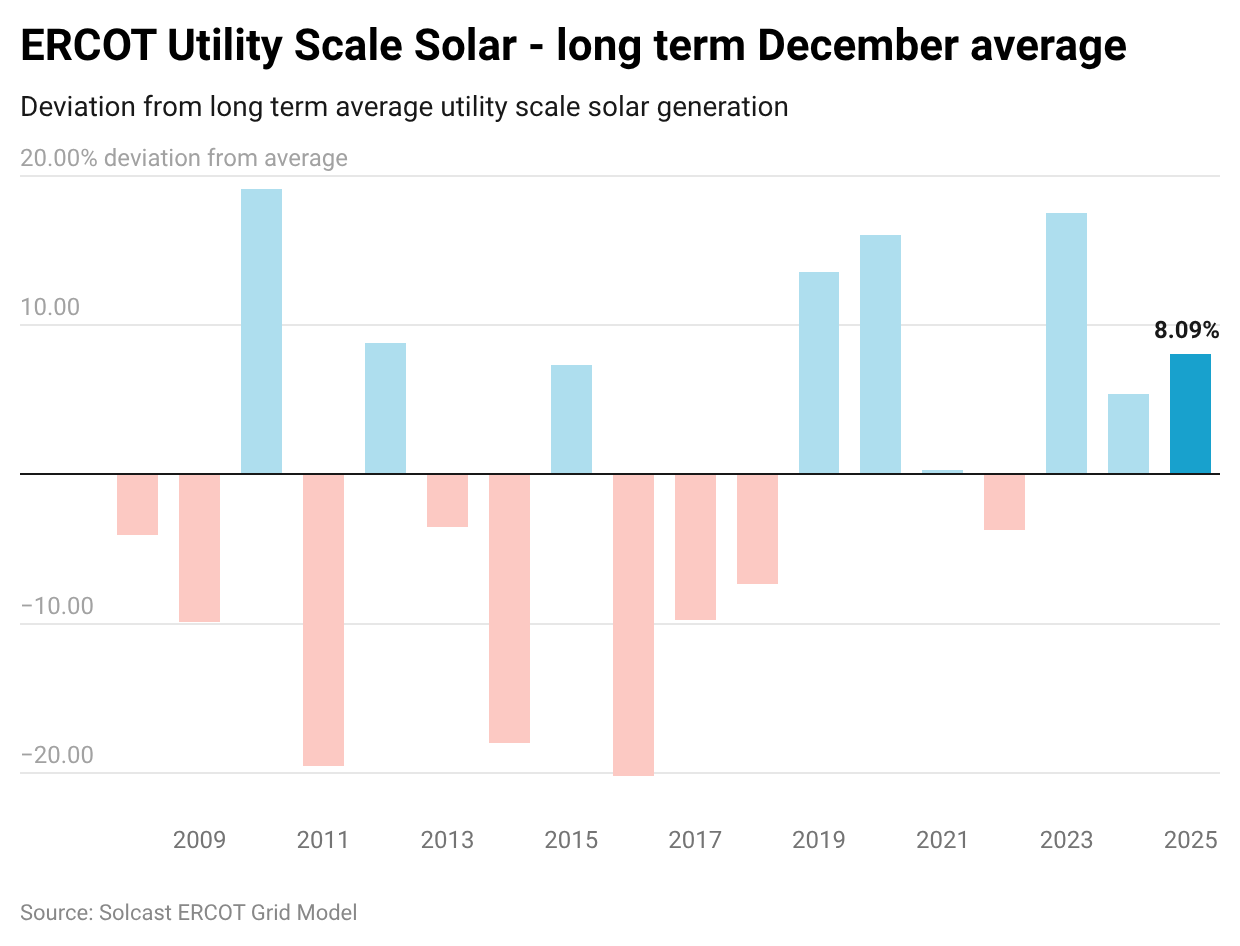
In contrast, regions under the ridge experienced subsidence and clear skies. From Arizona across Texas and into the Southern Plains, irradiance ran 10% to 20% above normal. Dry air advection extended this anomaly toward the Gulf Coast, reinforcing the sunny pattern. This configuration—wet Mexico paired with a dominant Southwest ridge—is a hallmark of La Niña winters. For solar operators, the practical impact was significant: assets in Arizona and Texas likely exceeded typical December irradiance by 10% to 15%. Solcast Grid Aggregation models show ERCOT utility-scale solar generation was 8.09% higher than average December conditions, representing more than 200GWh of additional potential generation.
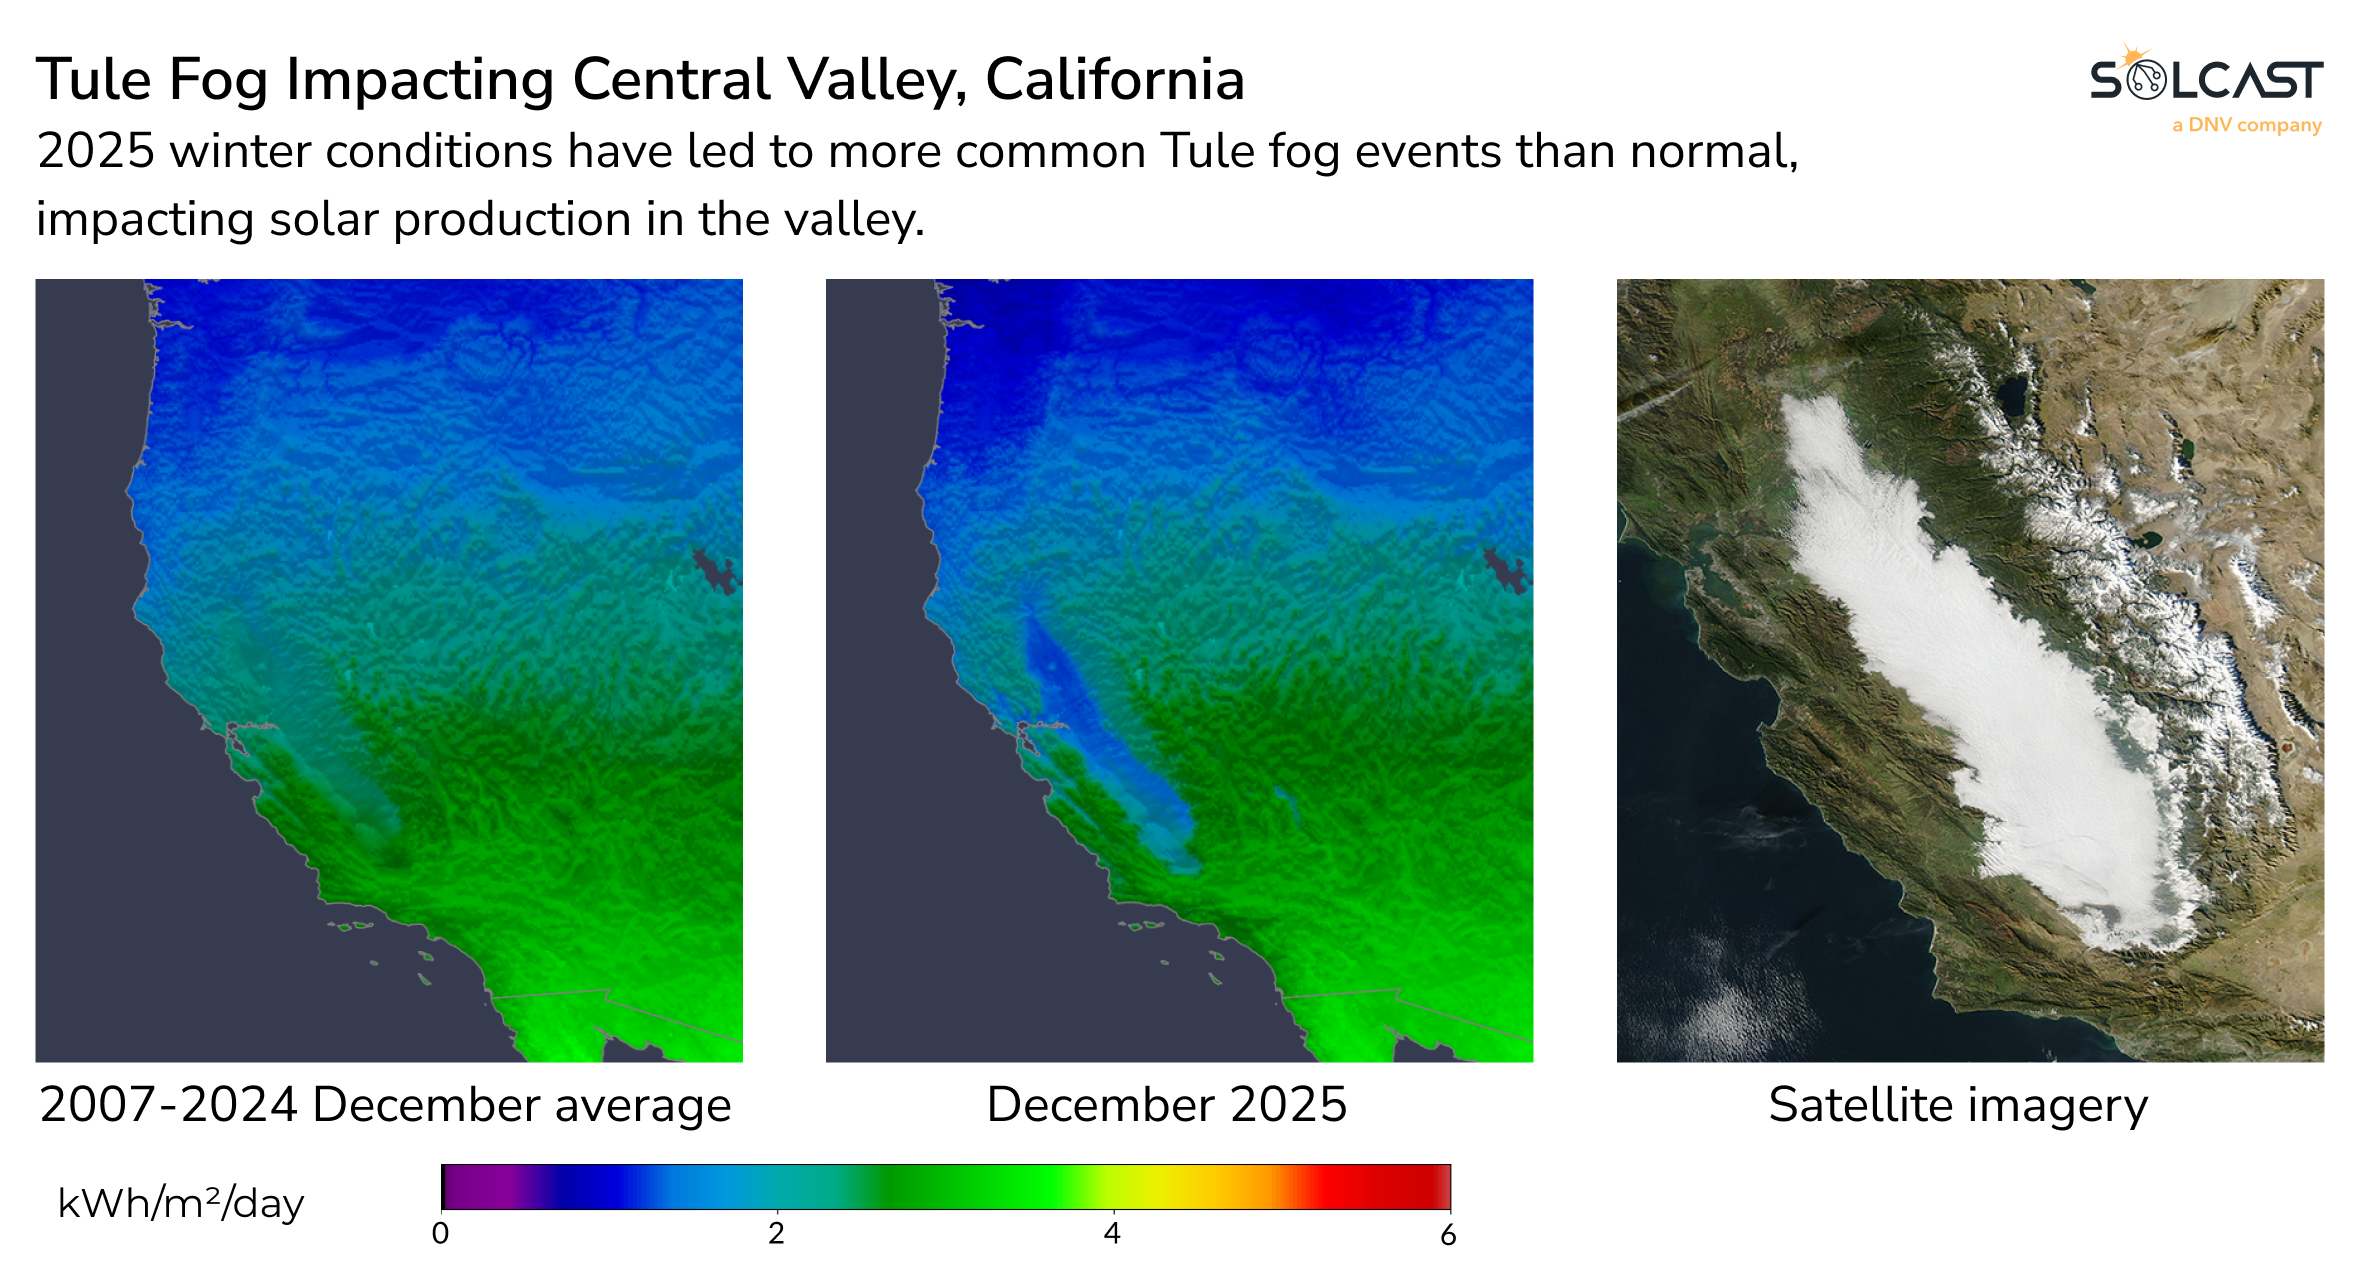
As continued from November, California’s central valley was impacted by tule fog for much of December, severely impacting solar assets in the region, with some fog-impacted parts of California seeing less irradiance than Toronto.
Overall, December’s irradiance map was shaped by a classic atmospheric setup: a blocking ridge suppressing Pacific storm tracks and amplifying contrasts between cloudy northern latitudes and clear southern skies. These dynamics underscore how large-scale circulation patterns can create sharp regional differences in solar resource availability.
Track weather conditions, cloud movements, and irradiance-influencing factors that might impact your solar generation. Access bankable actuals and accurate forecasts when you sign up for a Solcast API toolkit. You can reach out to our team for an extended trial.