


Dr. Hugh Cutcher
June 18, 2025
Share this post
Above average irradiance in the Amazon Basin during April and May 2025 has highlighted long-term shifts in local climate and land use that are altering cloud cover patterns and boosting solar potential. In contrast, much of the rest of the continent saw pronounced month-to-month fluctuations in irradiance due to a sequence of low- and high-pressure systems, which brought flooding to different regions in April and May.
.png)
Across the Amazon Basin, irradiance levels were 10% higher than the long-term average during April and May – months that typically mark the closing of the tropical wet season. This reflects a decadal trend towards drier conditions in the region, a development that has been linked to both deforestation and broader climate change.

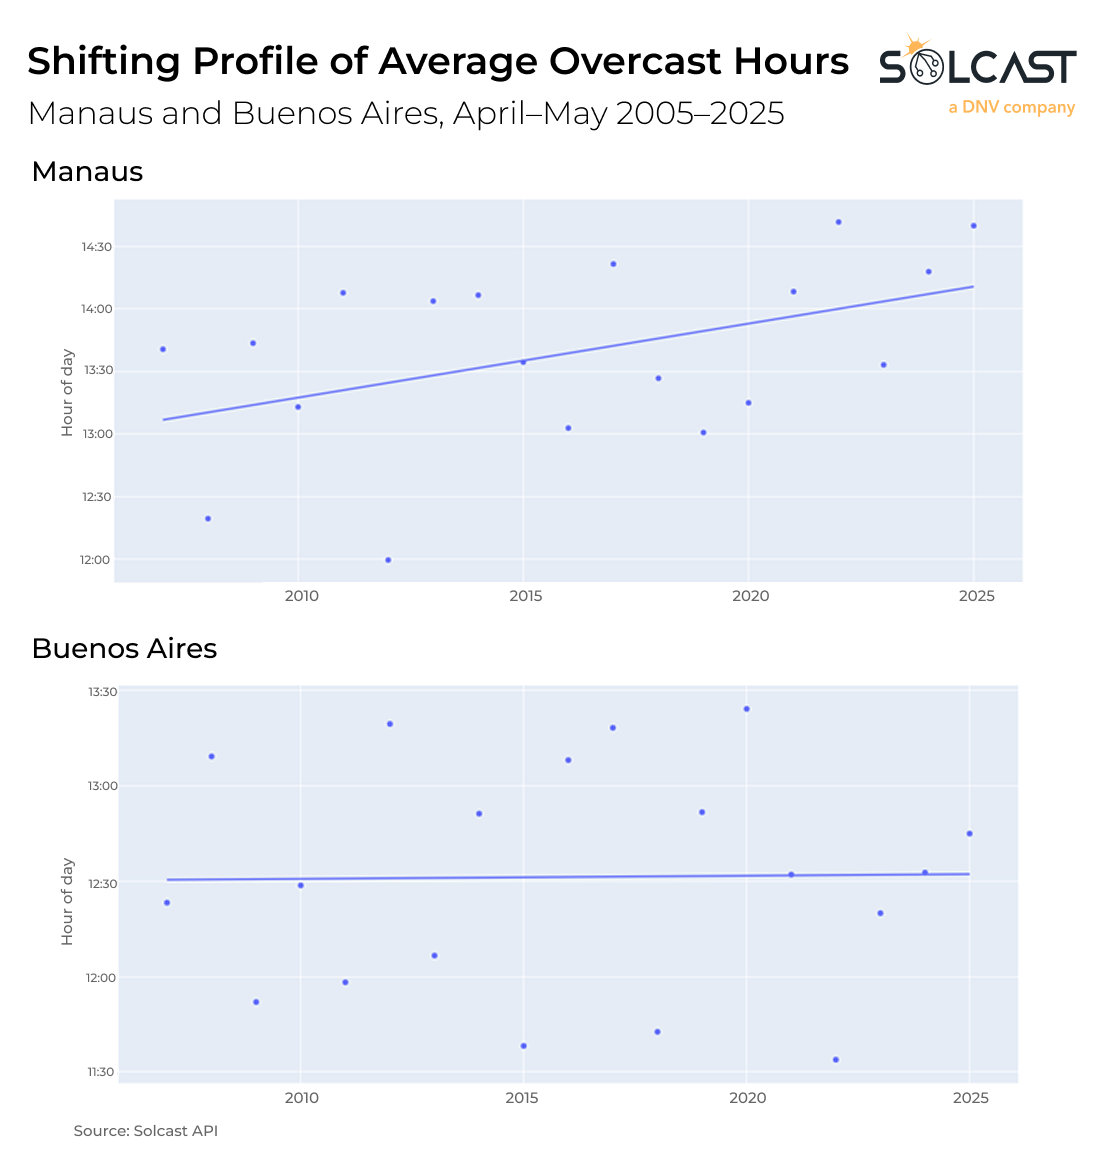
In-depth analysis of Solcast data for Manaus, in Brazil's Amazonas state, show a weak, positive trend in irradiance despite elevated levels of aerosols, including haze and smoke from recent regional fires. The long-term signals also suggest a changing cloudiness pattern during the day. The average time of overcast conditions at Manaus has shifted, now occurring after peak solar hours (i.e. less cloud during peak irradiance at midday). This contrasts with Buenos Aires, where no comparable trend is observed, illustrating that the changes we are seeing in the Amazon basin are not evident in other parts of South America. These findings are not conclusive but illustrate that there are many ways that a changing climate can reshape irradiance profiles.
Meanwhile, central South America experienced pronounced variability in irradiance due to intense weather events. In April, Southern Brazil, Paraguay, and Bolivia suffered serious flooding, triggered by low-pressure systems extending from the South Atlantic. These systems funnelled moist southeasterly winds into the region, leading to widespread rainfall, landslides, and a 20% drop in irradiance relative to the monthly average.
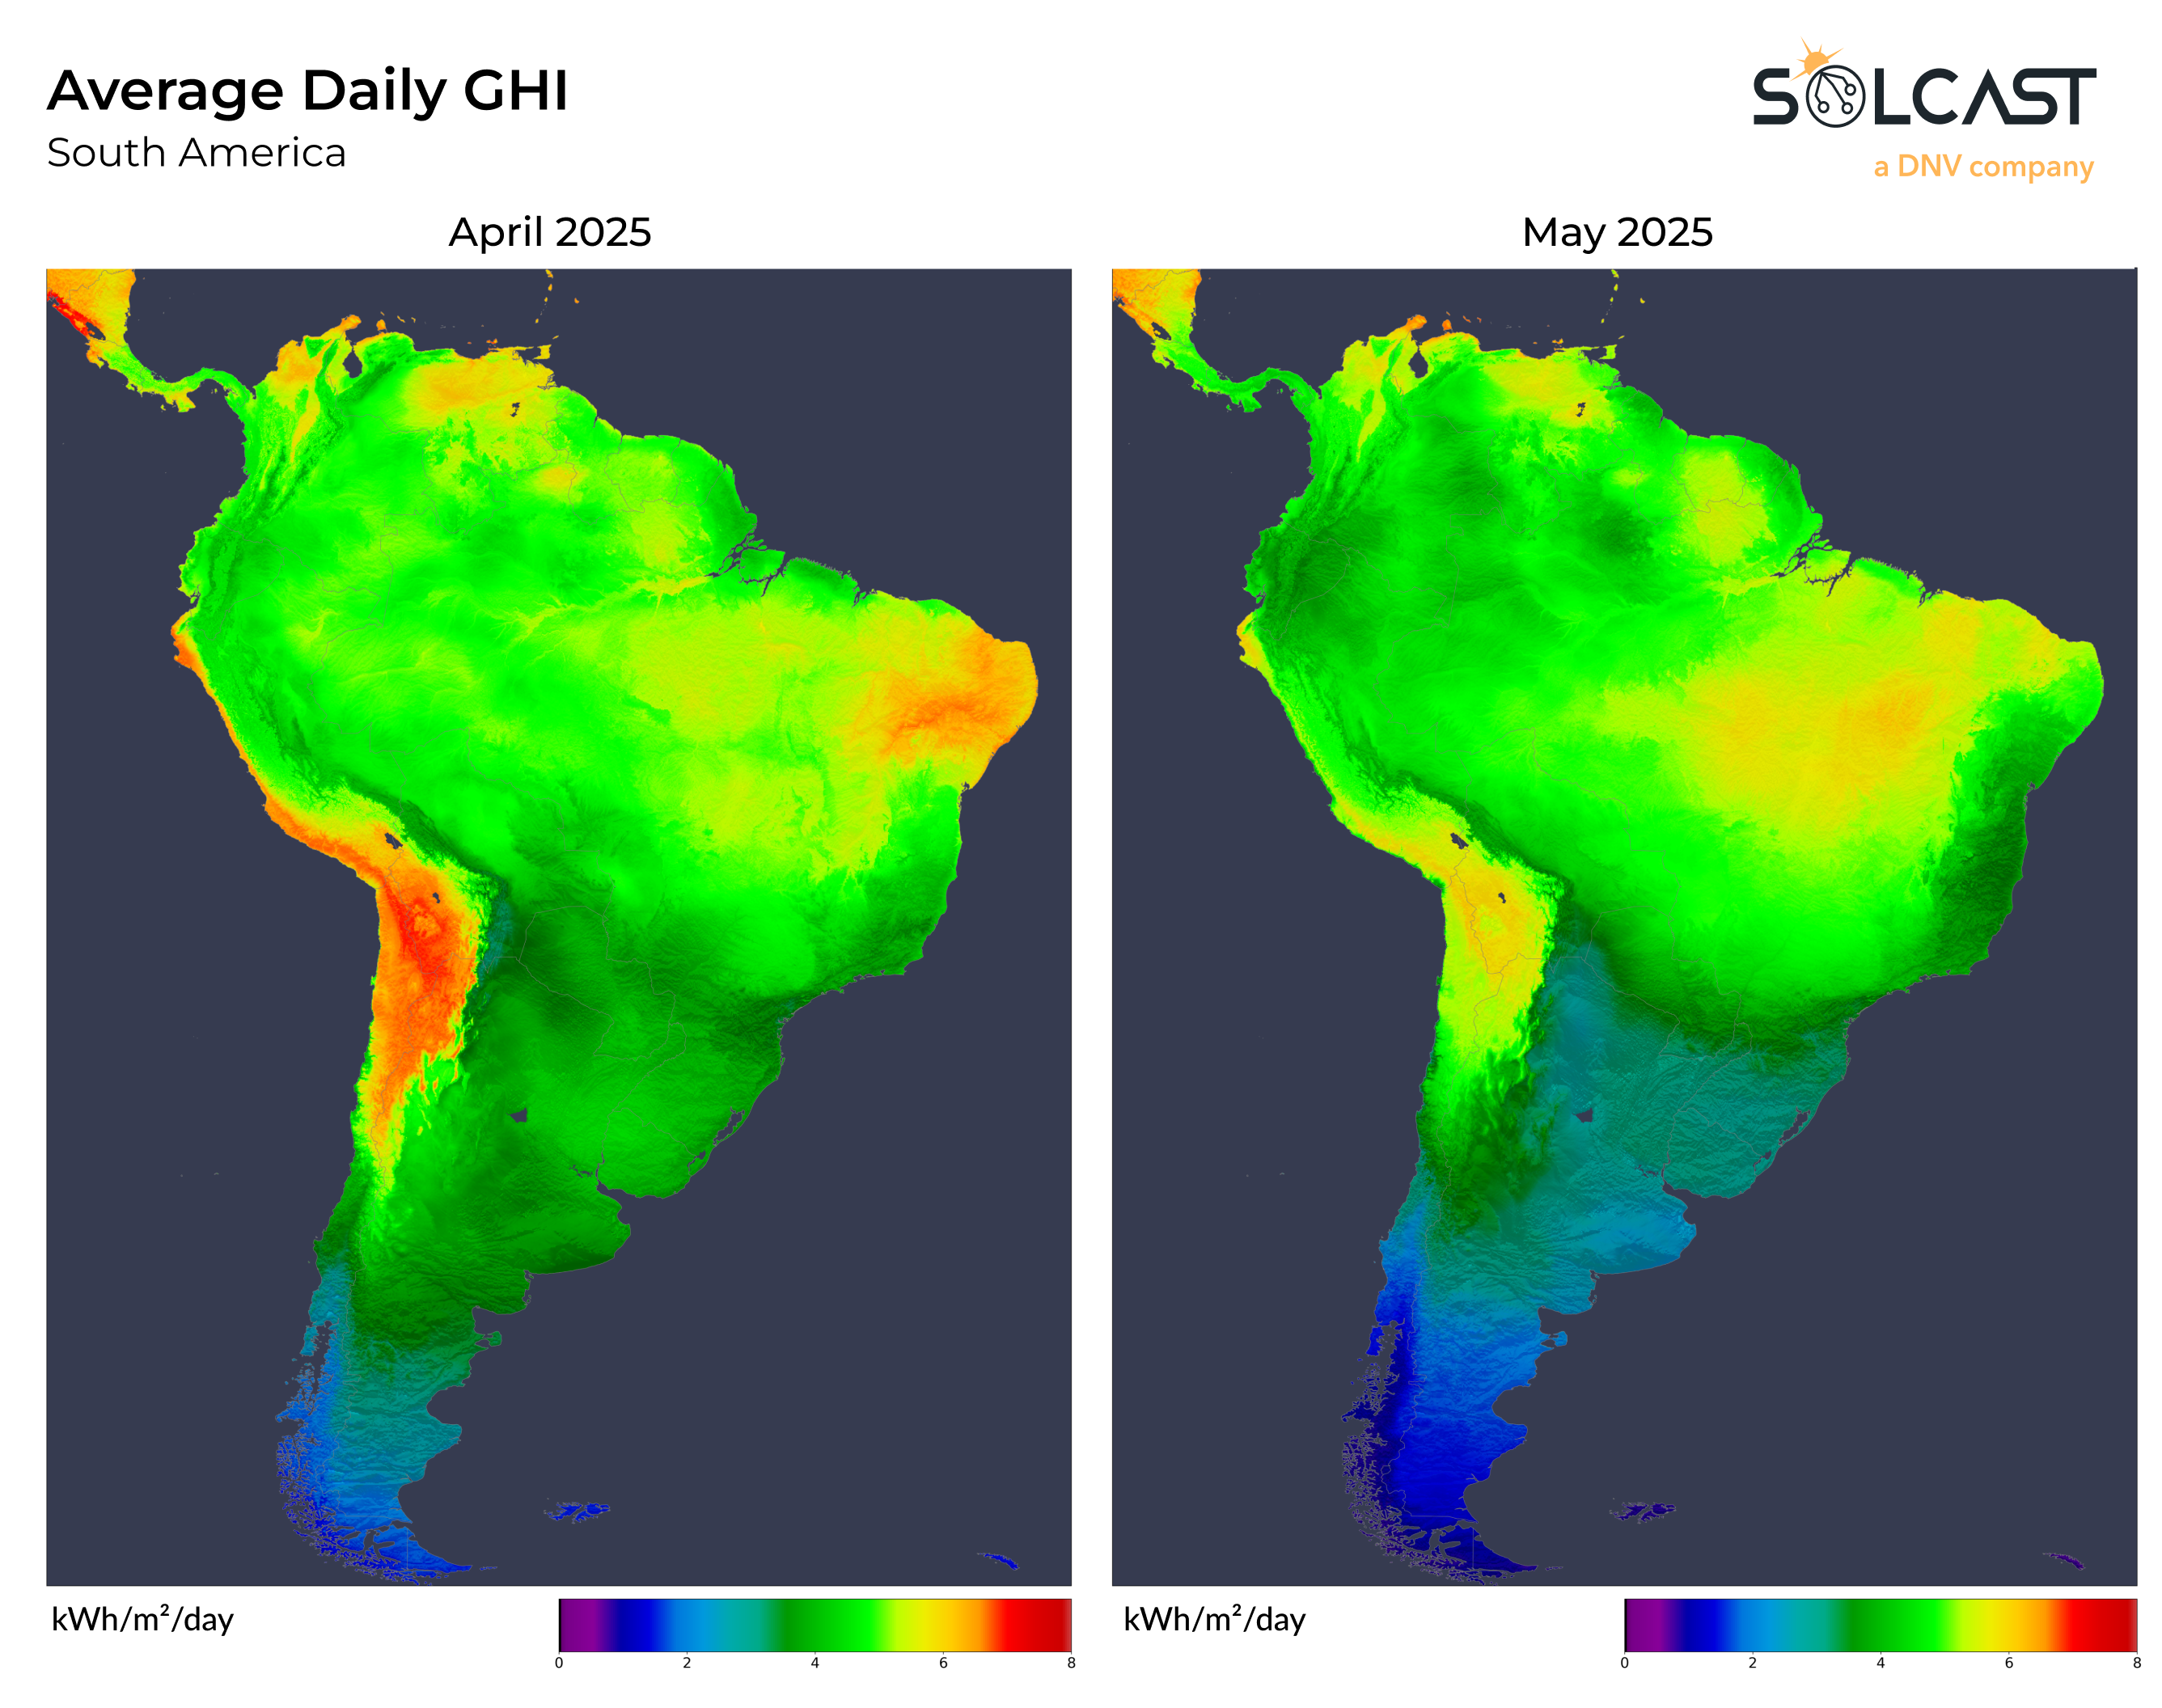
By May, a strong ridge of high pressure pushed into southern Brazil, reversing conditions. Irradiance jumped to 20% above normal as skies cleared and flooding subsided. At the same time, the moisture-laden systems shifted southward, bringing heavy rainfall to northern Argentina. There, the story flipped in the opposite direction—flooding rains reduced irradiance by 15%, capping off a turbulent two-month period across the region.
Track weather conditions, cloud movements, and irradiance-influencing factors that might impact your solar generation. Access bankable actuals and accurate forecasts when you sign up for a Solcast API toolkit. You can reach out to our team for an extended trial.