


Dr. Hugh Cutcher
October 2, 2024
Share this post
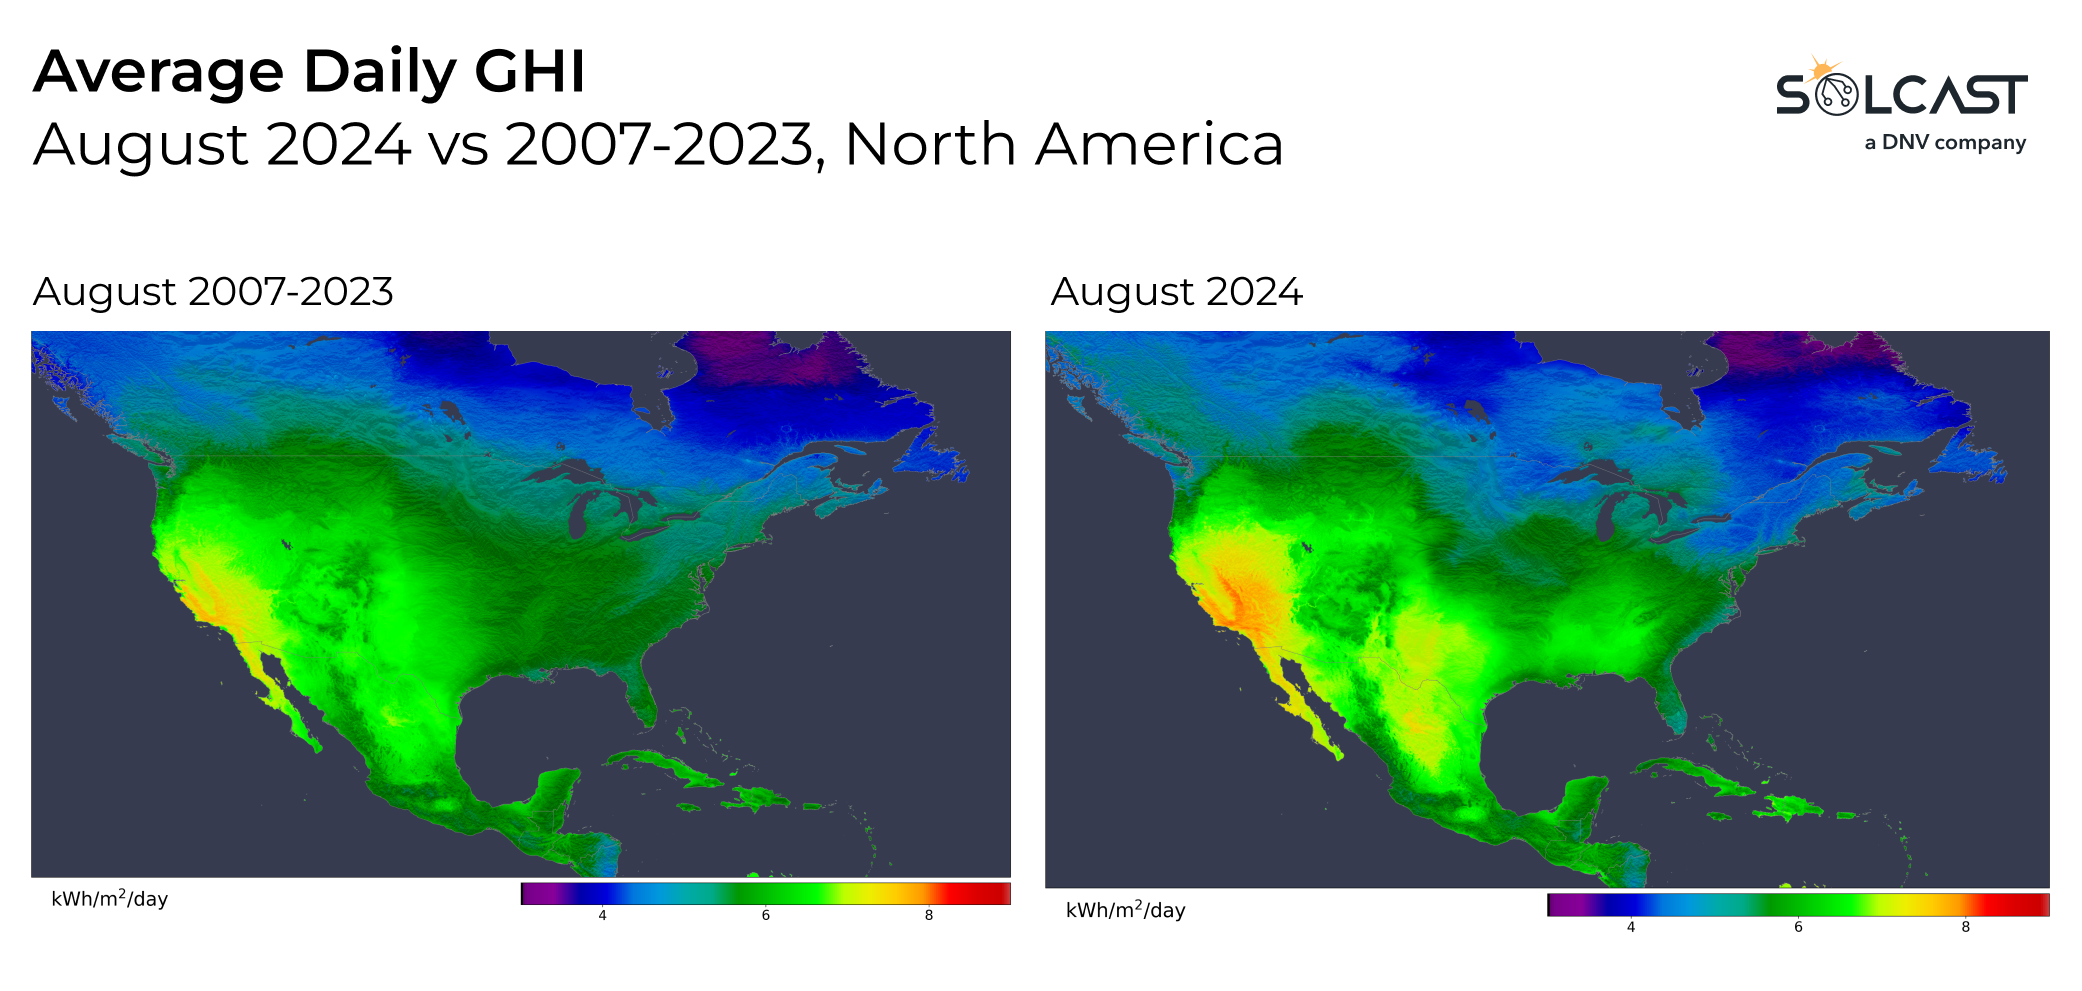
August 2024 marked an extraordinary month for solar energy production in the Southeastern states. A dominant high-pressure ridge in most of the US, particularly over the Southern Plains and Southern states, resulted in record-breaking warmth and irradiance levels. Meanwhile, regions like the Midwest and Northeast experienced cloudier conditions and lower irradiance due to the interaction between the jet stream flow and the high-pressure system.
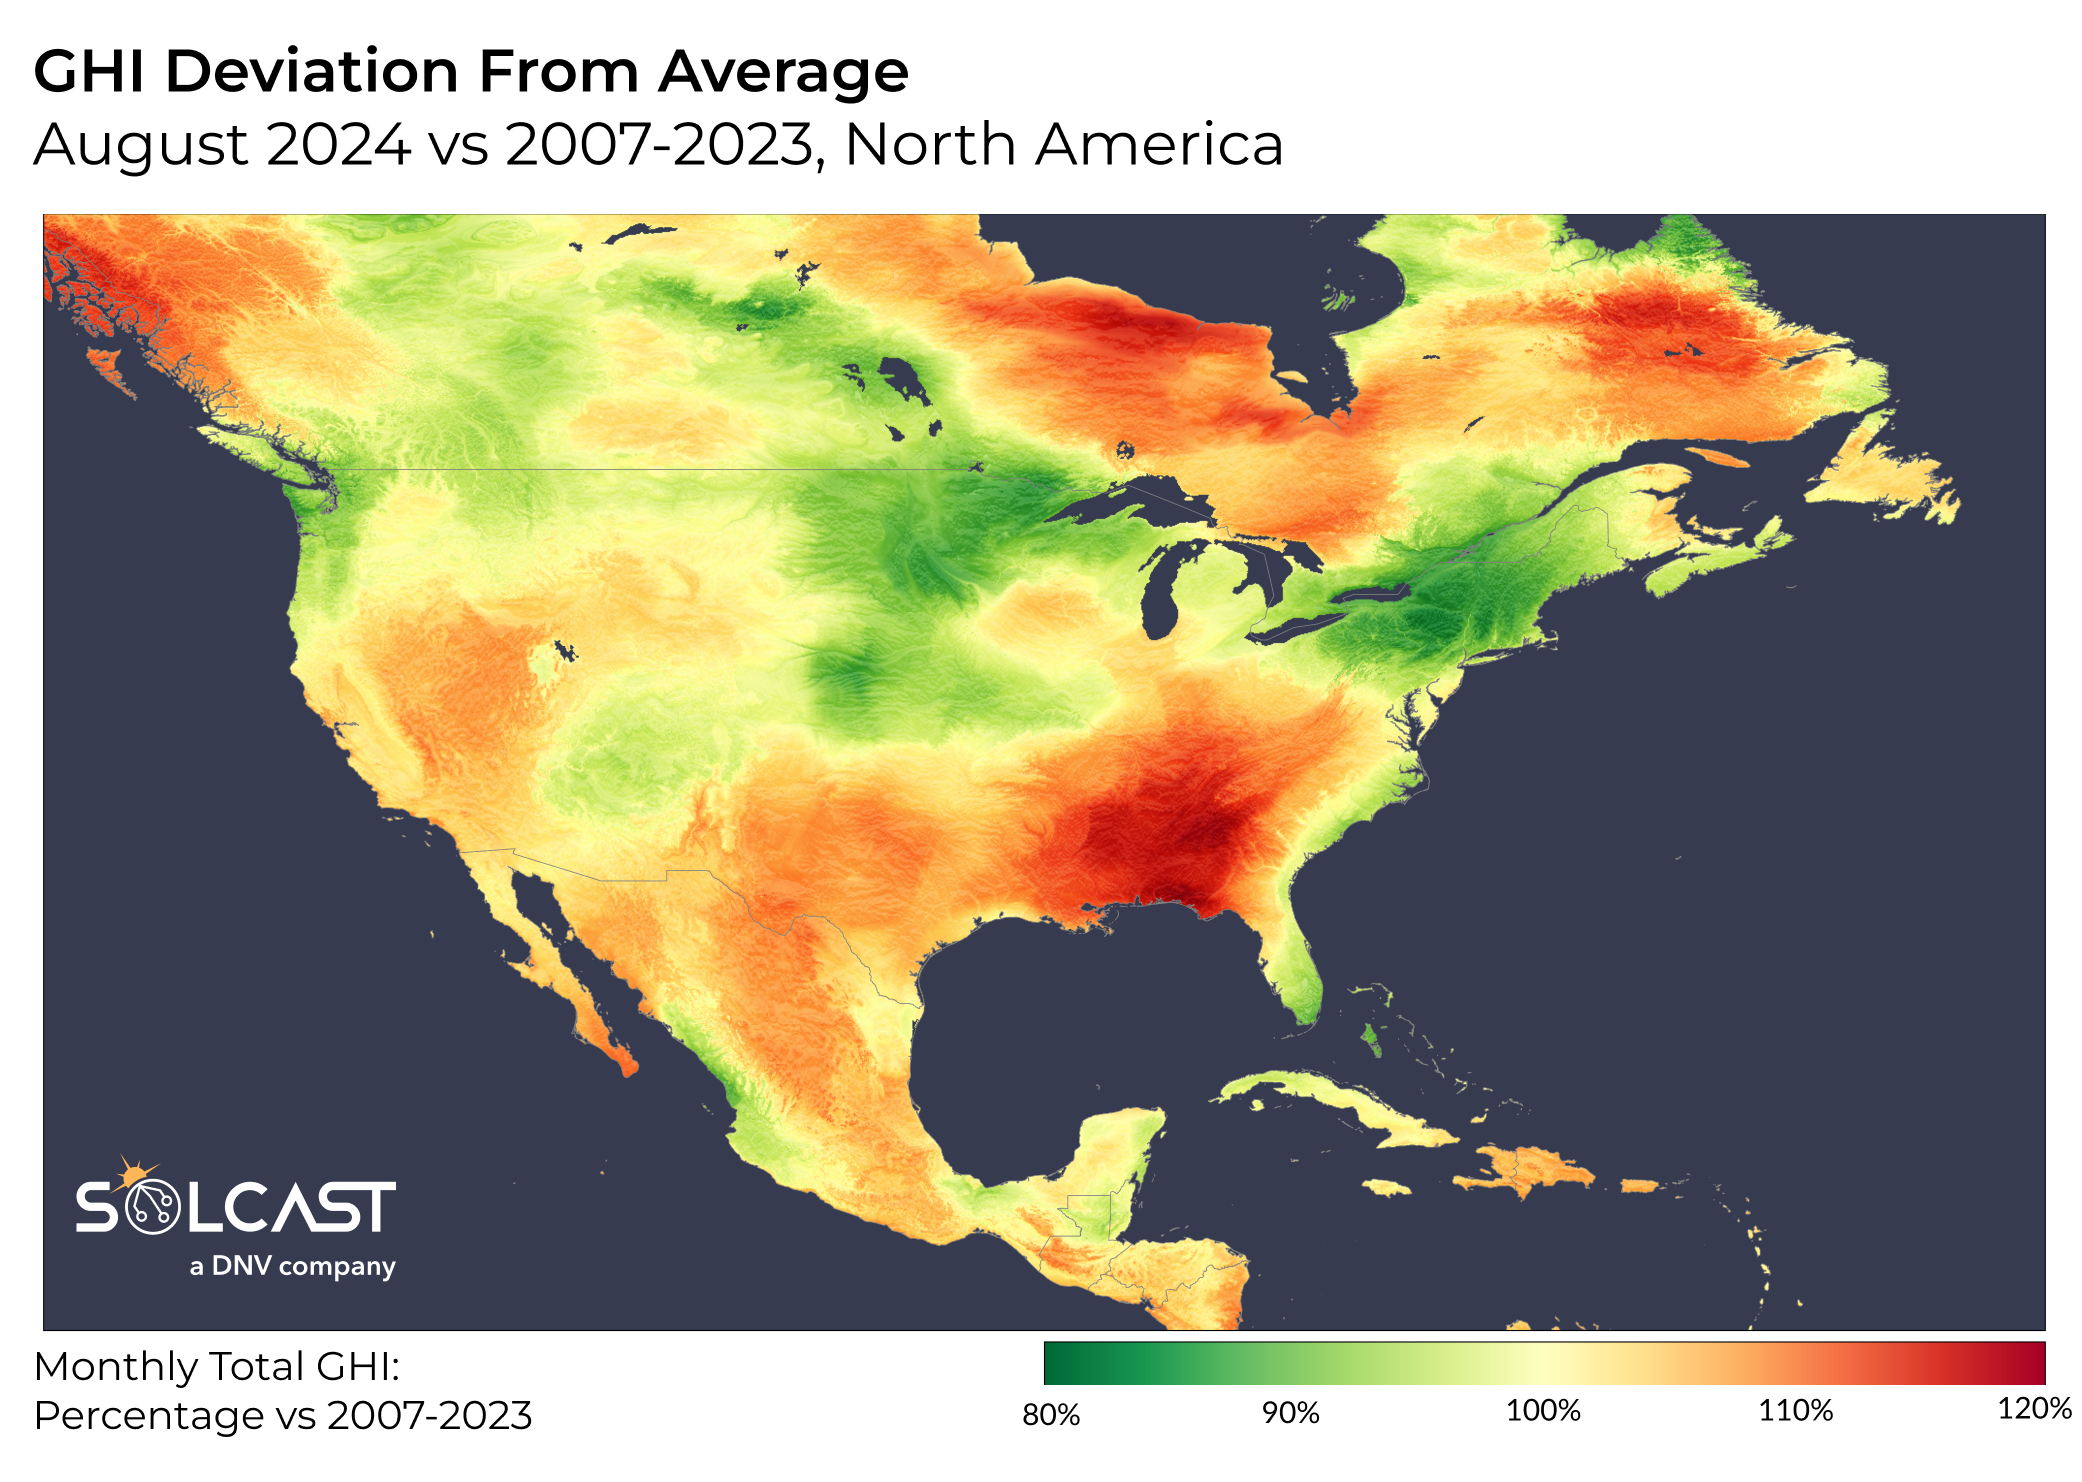
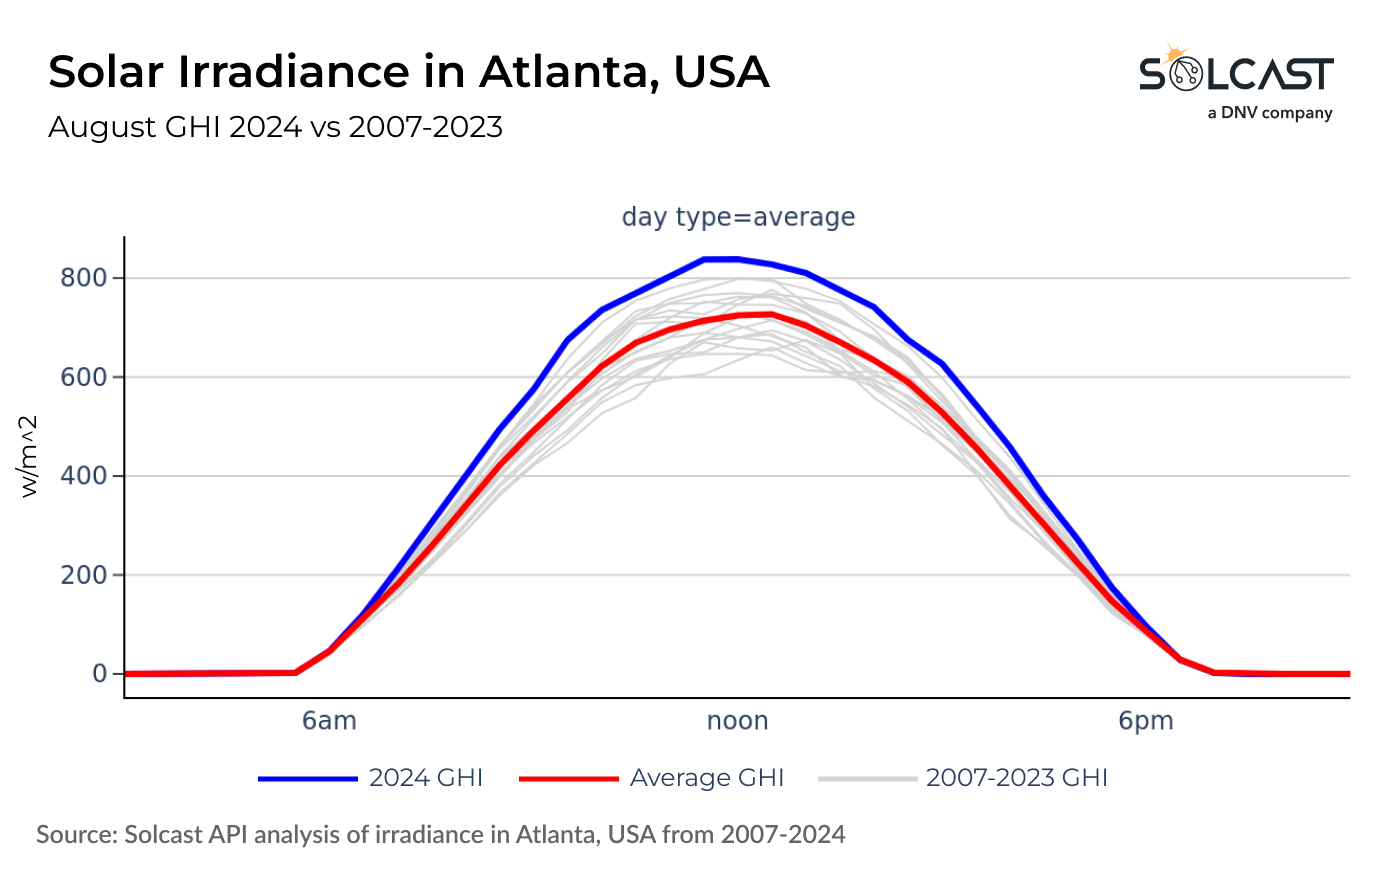
A high-pressure ridge across the continent persisted throughout August, delivering clear skies and above-average irradiance in the southern US. States such as Tennessee, Mississippi, Georgia, and Alabama saw irradiance levels up to 130% of their climatological average, with Atlanta recording its highest average daily August irradiance since 2007.
This clear-sky conditions followed a pattern of record-breaking temperatures and drought, as many southern states experienced exceptionally warm and dry conditions that persisted throughout the month.
In contrast, the situation was vastly different in the Midwest, Northeast, and parts of lower Quebec, where they experienced cloudier conditions. The high-pressure ridge diverted the jet stream further north, allowing Pacific low-pressure systems and cold fronts to converge over these areas with the warm air resulting in cloud cover, heavy rain and an irradiance of 20% below average. The northeastern US, in particular, experienced frequent showers that significantly reduced solar generation potential.
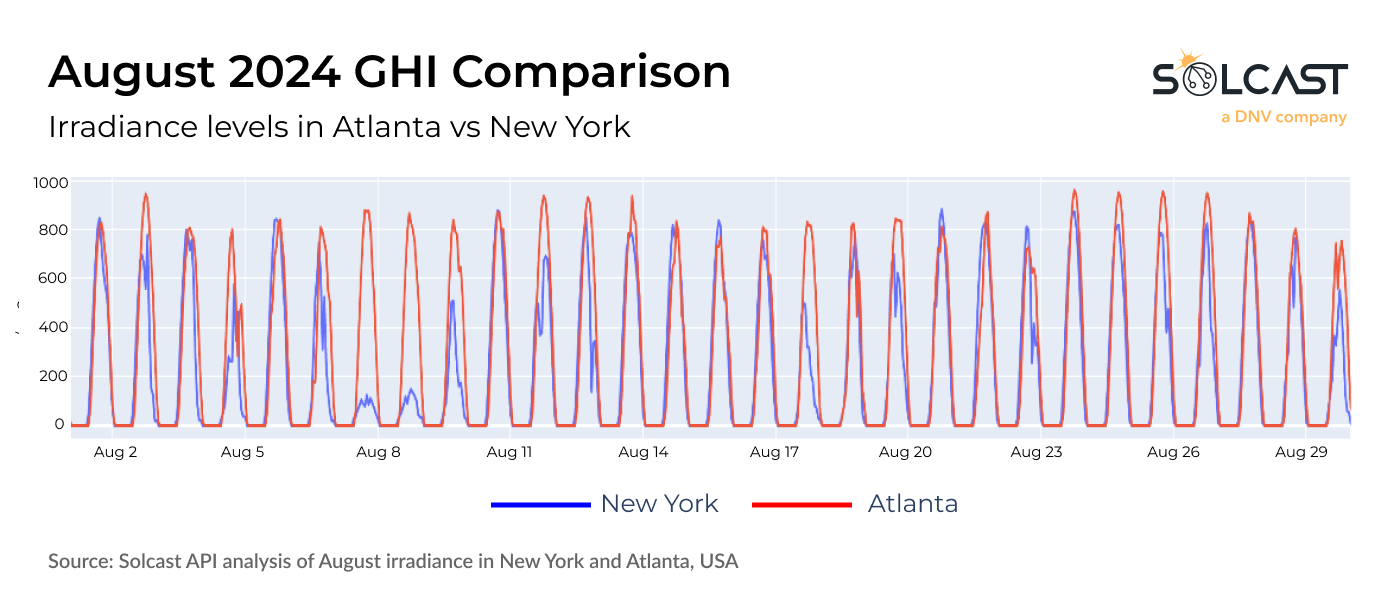
The graph above shows the stark difference in irradiance between Atlanta and New York. Atlanta, benefiting from an almost month-long-streak of clear skies, consistently recorded higher and more stable irradiance throughout August. In contrast, New York’s irradiance level reveals significant day-to-day fluctuations with many days of low irradiance derived from cloud cover. Including the August 17th catastrophic slow-moving system that brought flooding to the north east.
Track weather conditions, cloud movements, and irradiance-influencing factors that impact your solar generation. Access bankable actuals and accurate forecasts when you sign up for a Solcast API toolkit. You can reach out to our team for an extended trial.