


Dr. Hugh Cutcher
December 19, 2025
Share this post
In this TMY series, we’ve thus far covered temporal resolution bias (60-minute vs 15-minute) in TMY’s, as well as the financial consequences of TMY systemic underestimation and why utilising time series data can circumnavigate this. What we haven’t addressed is the additional complexity layer of the TMY variants and how time series data - on top of it’s accuracy demonstrated by DNV scientists - is easier to utilise than many engineers or specialists believe.
TMY methodologies vary between bankable providers, with one of the major differences being the definition of “Typical”, or how various meteorological parameters are combined. In attempts to best represent typical conditions and to create a establish a common definition, some in the industry have turned to Typical GHI Years (TGYs) and Typical DNI Years (TDYs) as a way to understand expected conditions for their sites.
So what is a TMY variant and why should I care?
When you order a TMY, you’re getting a file that is based on the providers standard approach to balancing different meteorological conditions. When using the Solcast API, or Solcast Toolkit you can choose your own weighting, otherwise defaulting to a 20:80 GHI:DNI weight. The choice of parameter weight can meaningfully impact your projected baseline. Here's a short introduction and comparison of each variant.
Note: Other variants exist too - such as Typical POA (Plane of Array) Year - but for simplicity, we're focusing on the most commonly encountered: TGY and TDY.
Choosing the right data greatly impacts how you set your projected baseline - essential for favourable project economics and realistic stakeholder expectations. When selecting a TMY file for your project, it's worth understanding what weighting was used because it can be a major source of uncertainty you might otherwise overlook.
Why there's no universal 'right' ratio
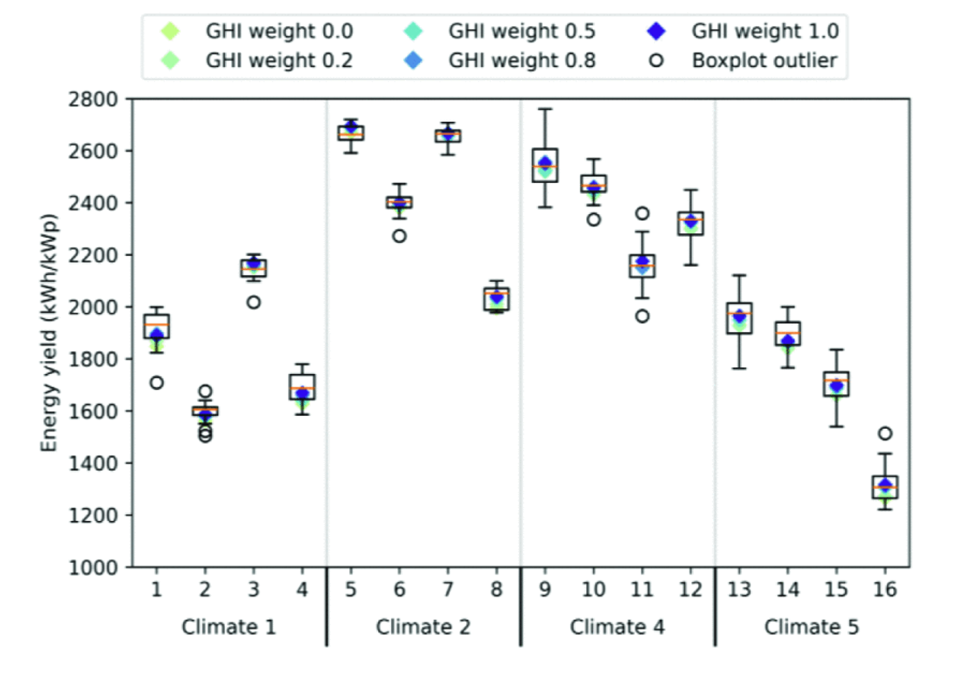
A global TMY study completed by DNV data scientists modeled energy yield from 16 sites across 4 climate zones using weighted ratios ranging from 0 (TDY/DNI-only) to 1.0 (TGY/GHI-only) and comparing to long term average yield. The results showed yield deviations of up to -5.7% for fixed-tilt systems and -4.6% for single-axis trackers, depending on ratio choice.
It was also noted that TGY’s were the most likely to return yields closest to the long-term average, but not universally, as shown below (darkest blue cross).
.png)
Additionally the findings indicate that the best GHI:DNI ratios to construct a TMY vary geographically, and there are no clear patterns as exhibited by differences within climates.
So if you’re using a TMY or one of its variants (TGY, TDY) then you are introducing irreducible uncertainty to your energy estimate.
Bypassing TMYs entirely
Previously unwieldy, time series data is now becoming a common standard as barriers in computing power, data availability, and established workflows fall away. Time series data gives you a much greater range of meteorological conditions rather than a single synthetic year - meaning you aren’t reliant on an proxy for average energy. Rather than letting the TMY methodology dictate the relationship between weather and energy you can model the relationship explicitly, capturing the complex non-linear interaction between the two.
The boxplot below shows the distribution of actual year-on-year energy yields from 17 years of time series data, with TMY variant yields overlaid. Notice how often the TMY estimates fall outside the interquartile range - the 'typical' year frequently… isn't.
In it’s conclusion, the authors Global TMY Study advocated for a “transition to Historical Time Series-based modeling as a new best industry practice" - so how do you actually make this shift if you’re not a specialist with this type of data?
Using time series data for actionable financial insights
Making this shift is less about acquiring new technical skills and more about adjusting your process. In practice, the main difference is feeding more years of data into your PV modelling software rather than a single synthetic year. The interpretation step - understanding what the historical distribution means for your project - does require some thought, but it's not fundamentally more difficult than working with TMYs. If anything, it's more transparent: you're seeing actual variability rather than relying on a proxy
A practical approach for non-specialists:
- Start with the right data: Go beyond simply sourcing a dataset. Interrogate provider methodologies, check spatial and temporal resolution, and review validation studies. Understand how many years are included and why that window was chosen. For example, Solcast uses data starting from 2007, based on the availability of global high-quality satellite imagery required for high resolution, sub-hourly irradiance modelling and reliable validation. One methodology IE’s like DNV utilise is Maximum Likelihood Estimation to help score and select the best data source for a specific region.
- Calculate the expected average long-term yield:
Model the long term energy yield for all years of data in your time series dataset, and look at the average and variability of energy yield across years. The average represents your best estimate of long-term performance and is the foundation for financial modeling and investment decisions. - Assess variability in energy space: With time series data, you can calculate inter-annual variability directly in energy terms - explicitly understanding how weather variability impacts the expected range of yearly energy yields, not just irradiance. This is a key advantage over TMY-based approaches, which deliver a single estimate rather than a distribution. The Global TMY study found that TMY-derived long-term average yields often differed from those calculated using historical time series - meaning your baseline estimate itself may be off. The uncertainty in energy estimates introduced by TMY assumptions is expected to apply to year-to-year variability as well. By modelling across multiple years, you gain both a more accurate long-term average and more reliable estimates of the variability your project may actually experience.
- Apply to financial modeling: Use your refined time series dataset to adjust IRR and debt sizing assumptions, and to model scenarios for high and low energy producing years.
While robust financial modeling should always be a priority, leveraging multi‑year, sub‑hourly time series data is a proven pathway to lowering uncertainty and enabling more confident investment decisions and better long‑term outcomes.
By following these steps, you can move beyond the limitations of TMYs and their variants and build a financial model that reflects real variability and risk. This approach empowers teams to secure more favourable financing and set realistic expectations for asset performance.