


Harry Cheselwoods
March 20, 2026
Share this post
Beyond monitoring: An intelligence layer for distributed solar
Popular Power provides an intelligence layer for distributed solar and storage for PPA providers, IPPs, and commercial solar operators across the Americas.
Popular Power is built on a simple insight: monitoring data alone doesn't drive results.
"We really double down on the insights that our platform provides. It's very outcome-focused. We're going to tell you the amount of money you're leaving on the table, and which issues are possibly going to cost you the most."
Morgan Babbs, co-founder of Popular Power.
For Popular Power's customers – many of whom sell electricity through PPAs or provide ongoing O&M guarantees – data is essential in managing their assets, and therefore their revenue. Every operator has monitoring data, but the challenge lies in understanding how to use their data to protect revenue, meet guarantees, and grow faster. The question isn't whether they have the data; it's whether they can translate that data into action.
Flying blind without real-time weather context
Most solar operators currently rely on Typical Meteorological Year (TMY) data to establish baseline performance expectations at the project's outset. But a TMY is a synthetic representation of a year's data, built for financing and to represent average conditions – not what's actually happening on site today. Once a system goes operational, the weather data that matters is live conditions.
Utility-scale sites have long used on-site weather stations to weather-adjust their performance benchmarks. But most distributed and C&I sites don't have weather stations — so TMY becomes the only available baseline by default, not by choice.
This creates a significant blind spot. When a site underperforms against its own TMY baseline, operators face a diagnostic problem: Is it the weather, or is something wrong with the asset?
"A lot of companies stop at TMY. They're never again looking at what's going on with the weather in real time during the lifetime of the asset. And that of course is a huge missed opportunity."
- Morgan Babbs, Co-founder, Popular Power
Your site looks healthy. You're still losing money.
Without an on-site weather station, most distributed solar operators benchmark against TMY — and never see the gap.
.png)
The alternative is straightforward. Instead of comparing actual generation against a TMY-based energy estimate, operators can compare it against expected generation calculated using satellite-derived irradiance data — a weather-adjusted performance ratio. Popular Power calls this "climate-adjusted performance tracking." Satellite-derived irradiance removes the need for on-site weather stations, making this analysis accessible across a distributed portfolio — regardless of site size.
Most operators never make this comparison — and the cost adds up:
- Hidden performance gaps: A site meeting its TMY target can appear healthy while capturing as little as 78% of its weather-adjusted potential – and a site flagged as underperforming may be twice as bad as conventional benchmarks suggest.
- Misallocated O&M resources: Without weather or 'climate' context, it's difficult to prioritize which sites need intervention.
- Manual workarounds: Some operators attempt spreadsheet-based comparisons, but these are typically quarterly or semi-annual and time consuming.
"People sometimes ask whether on-site sensors give you better data than satellite. Maybe marginally. But does it change what you do? If your ground sensor says you're leaving $9,200 on the table and satellite says $9,000, you're still cleaning those panels. Precision for its own sake isn't the goal. The goal is intelligence that drives action."
- Morgan Babbs, Co-founder, Popular Power
Weather-adjusted performance tracking
Popular Power integrates Solcast's satellite-derived irradiance data and power models to calculate what each site should have generated given the actual weather conditions – not just what was modelled in the business case based on traditional average weather conditions.
This enables their core Advanced Performance Tracking feature, which presents operators with three critical metrics simultaneously:
- Performance vs. Target: How the site performs against its original estimated baseline (commonly via a TMY model that provides a P50 or P90)
- Performance vs. Climate: How the site performs against what it should have generated given actual conditions
- Site Health Rating: A 1-5 rating that synthesizes performance data into clear, prioritized action
Popular Power's formula is as follows: Climate Performance = Actual Generation ÷ Popular Powers 'Climate Model' Expected Generation
When these metrics diverge, the diagnostic value becomes clear. A site meeting its annual target but showing poor climate performance is leaving money on the table – and Popular Power can tell operators approximately how much.

%2014.50.45%20(1).png)
Why Solcast?
When Popular Power evaluated weather data providers for their climate adjusted performance model, several factors drove their decision:
- Ease of testing: The API allowed rapid validation without complex procurement
- Clear integration path: No confusing endpoints or excessive configuration options
- Quality fit for solar PV: Data resolution and accuracy appropriate for C&I asset management
- Professional support: Responsive engagement for when the relationship scaled
"It was very easy to test with a clear API path forward that met our quality requirements for solar PV applications."
- Andrés Prada, Head of Data & Analytics, Popular Power
Built into the platform from launch
Climate-adjusted performance tracking launched as a core component of Popular Power's V2 platform, with the integration designed for scale from the start.
Technical approach
Popular Power integrated Solcast's satellite-derived irradiance data via API and applies their own power model to calculate expected generation. This approach provides:
- Real-time updates: Performance tracking reflects real conditions, not historical averages
- Portfolio-wide coverage: New sites can be onboarded immediately with historical data backfill
- Automated recommendations: The platform identifies intervention opportunities and quantifies their potential value based on real performance

Scaling with the portfolio
The Solcast API delivers data to more than 26 million locations every day, so Popular Power knew that their access to data would not be impeded as they scaled. As Popular Power grew from early customers to managing more than 500MW across the Americas, it has become more important that their data partners are reliable, safe and easy to work with.
“For us, depending on where our customers are, we always need to pull more locations and that has been very easy, very seamless. In fact, we keep setting limits for ourselves based on expected growth, and then catch up to them pretty quickly and we need to access more locations. So yeah, I mean, it's been pretty easy.”
- Manuel Wiechers, Co-founder, Popular Power
Results and benefits
Quantified improvement opportunities
Across their portfolio, Popular Power has identified an average improvement opportunity of 250 MWh per MWp per year representing approximately $30,000 USD per MWp in potential additional value at typical C&I rates ($0.12 USD/kWh).
Compared to the industry average generation of approximately 1,500MWh/MWp annually, this represents a +16.7% performance improvement opportunity that would be impossible without climate-adjusted tracking.
How weather-adjusted metrics change operational decisions: Two site examples
The diagnostic value of weather-adjusted tracking becomes clearest at the site level. The following two examples from Popular Power's portfolio illustrate how the same underlying capability — comparing actual generation against weather-adjusted expectations rather than static TMY baselines — surfaces hidden performance issues in different scenarios.
In one case, TMY-based benchmarks flagged underperformance but significantly underestimated its severity. In the other, they missed the problem entirely.
Before and after: Site intervention example #1
Before intervention (February 1–10):
%2014.51.19%20(1)%20(1).png)
- Performance vs. Target: 60% (appearing to underperform)
- Performance vs. Climate: 41% (revealing significant operational issues)
The TMY-based target suggested the site was underperforming, but the climate-adjusted metric revealed the true magnitude: the site was capturing less than half of its climate-adjusted potential.
The climate-adjusted metric turned a concern into something actionable. A site delivering just 41% performance, capturing less than half of the energy available given actual weather conditions, needs to be addressed. This wasn't a weather problem — it was a performance improvement opportunity.
After intervention (February 16–25):
%2014.52.02%20(1).png)
- Performance vs. Target: 126% (now exceeding baseline)
- Performance vs. Climate: 77% (significant improvement, with further optimization possible)
- Actual Generation in 10 day period: 19.50 MWh in comparable period
Following the cleaning, the site more than doubled its output. Without climate-adjusted tracking, this intervention might never have happened — the operator could have waited indefinitely for "better weather" while revenue slipped away each day.
The difference: Generation more than doubled in a comparable period — from 9.28 MWh to 19.50 MWh over 10 days —translating directly to recovered revenue.
Site #1 illustrated a case where both metrics signalled underperformance — climate-adjusted tracking simply revealed the true magnitude. Site #2 tells a subtler and arguably more common story: a site that appeared healthy by every conventional measure, but was quietly leaving generation on the table.
Before and after: Site intervention example #2
Before Intervention (March 3-11):
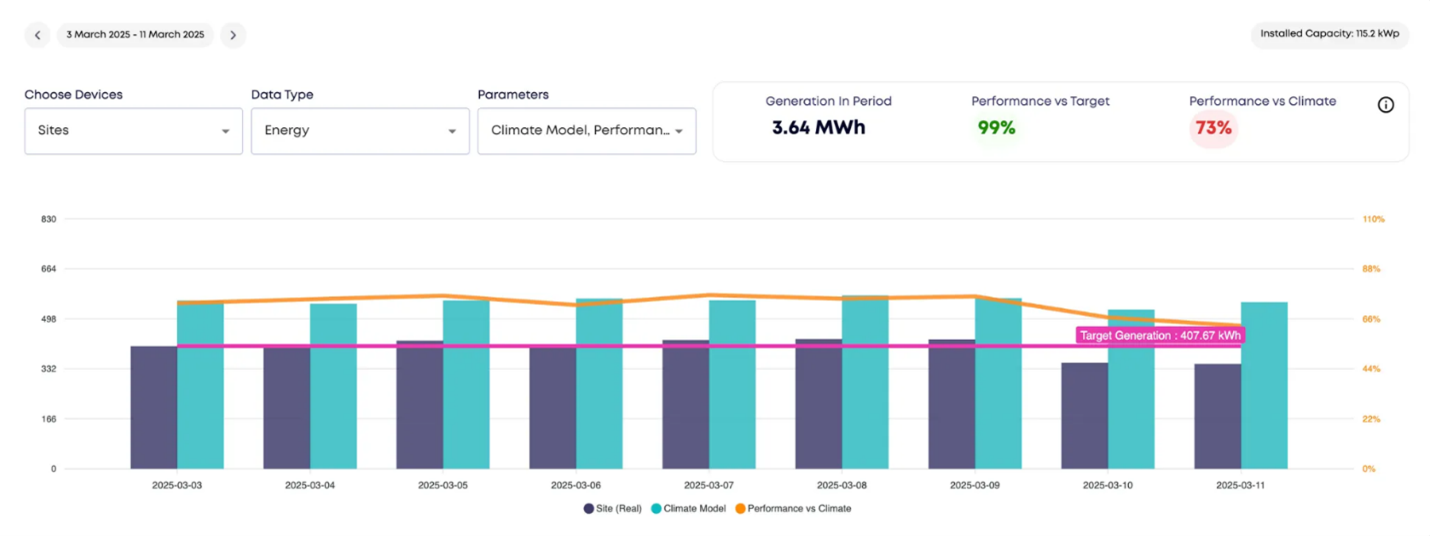
- Performance vs. Target: 99% (appearing on track)
- Performance vs. Climate: 73% (revealing hidden improvement opportunity)
- Daily average generation: 0.404 MWh
Before intervention, the site was tracking at 99% Performance vs Target — effectively meeting its commitments. Under traditional TMY-based monitoring, this site would not have been flagged. There was no apparent problem to solve.
But the climate-adjusted view told a different story. At 73% Performance vs Climate, the site was capturing barely three-quarters of the energy available given actual weather conditions. The gap between what the site was contracted to deliver and what it could deliver represented a material revenue opportunity that conventional benchmarks rendered invisible. Based on the climate-adjusted performance, Popular Power recommended cleaning the panels.
This pattern is more common than operators might expect. Performance commitments in distributed solar are often set conservatively, meaning a site can comfortably meet its targets while still significantly underperforming relative to real conditions. Climate-adjusted tracking surfaces this gap — and in doing so, helps all stakeholders align on what reasonable performance actually looks like. Popular Power recommended panel cleaning.
After intervention (March 12–21):
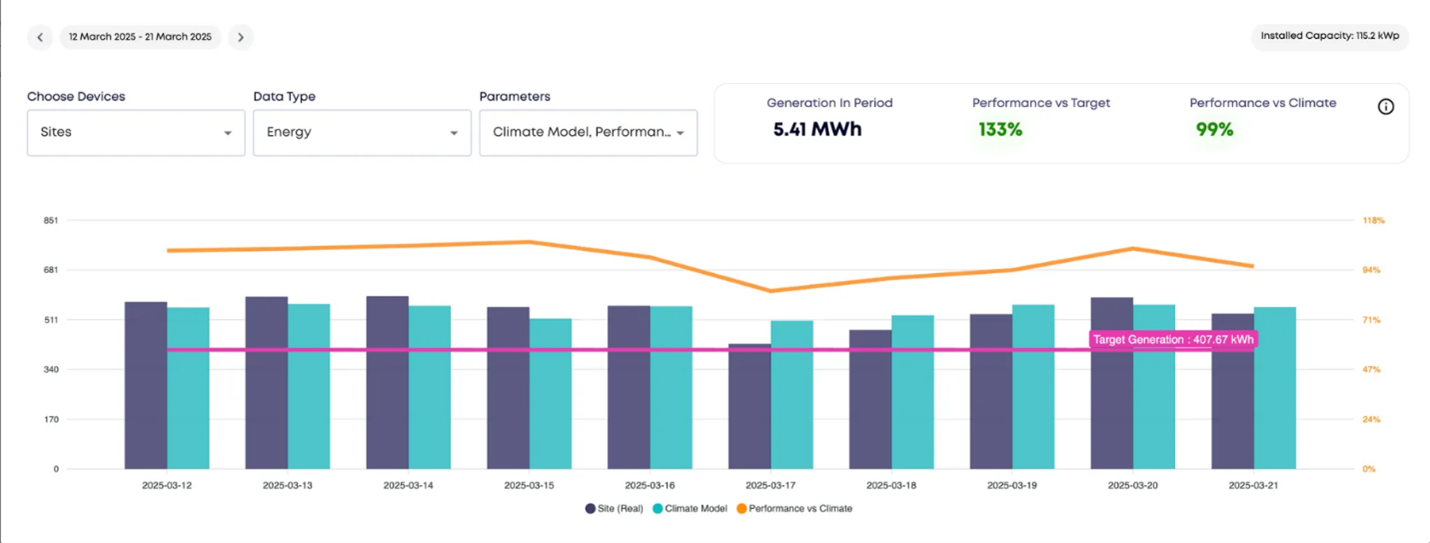
- Performance vs. Target: 133% (now significantly exceeding baseline)
- Performance vs. Climate: 99% (near-complete capture of available potential)
- Daily average generation: 0.541 MWh (34% increase on previous period)
Following the panel cleaning, the results were immediate. Over a comparable period (March 12–21), the site jumped to 133% Performance vs Target and 99% Performance vs Climate — near-complete capture of available climate-adjusted potential. On a daily average basis, generation increased by approximately 33% following the intervention. The impact of the intervention is visible below.
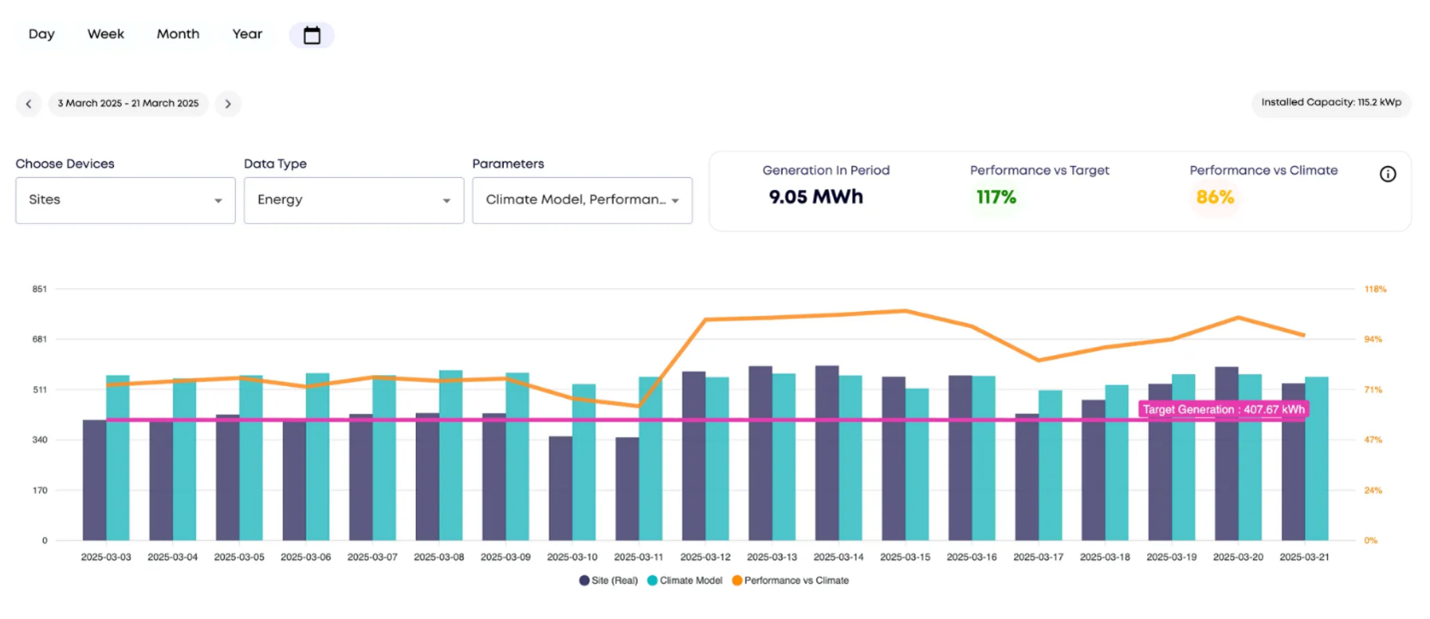
Where Site #1 demonstrated climate intelligence catching a problem that TMY baselines underestimated, Site #2 shows something potentially more valuable: catching a problem that TMY baselines missed entirely.
Operational benefits
Beyond quantified savings, climate-adjusted tracking delivers:
- Faster issue identification: Distinguish weather-related underperformance from operational problems immediately
- Automated O&M prioritization: Site Health ratings direct attention to sites with the highest improvement potential
- Quantified ROI for interventions: Every recommendation includes projected financial impact
- Contract protection: Operators can demonstrate performance relative to actual conditions, not just static targets
Popular Power's approach is built on the principle that insight without evidence doesn't change behaviour. As Babbs puts it: "We don't want to just tell — we want to show. Climate data ensures you are not operating without visibility." Every recommendation the platform surfaces is backed by quantified financial impact — not just a flag that something might be wrong, but a specific dollar figure attached to the opportunity cost of inaction.
Looking ahead
Popular Power is positioning climate-adjusted intelligence as the standard of excellence for distributed solar asset management. As the platform evolves, their roadmap points toward increasingly sophisticated capabilities — from leveraging historical performance patterns to deliver more targeted intervention guidance, to ML-driven models that predict optimal cleaning schedules and maintenance windows. Beyond solar, extending the intelligence layer into distributed storage represents a natural next step.
"This industry is young enough that the standard of excellence hasn't been written yet. That's an enormous opportunity. Climate data should be the baseline now; but how you use it is where operators differentiate. We're trying to be the platform that defines what 'good' looks like, and then helps operators get there. "
Morgan Babbs, co-founder of Popular Power.
Visit: Popular Power
See: Solcast Live and Forecast Data | Solcast Historical Time Series