The role of TMY data in solar project modeling
Typical Meteorological Year (TMY) datasets are common-place in solar project modeling and financial analysis. Since the late 1970’s, 60-minute interval TMY data files—commonly called “8760s”— have been used as the standard input for yield modeling, resource assessment, and investment decisions. At the time, these tools were designed for building energy modeling, and the combination of available weather data, computing power, workflow compatibility, and data-handling practices made them a high-resolution and effective option for project analysis and financing. Consequently, industry-standard tools have been built to natively support 8760s, and while they can accept other formats through workarounds, the 8760 remains the default for many analysts across our industry.
In the 50 years since TMYs were developed, compute power and technical advances in meteorology mean there is no longer a good reason to be limited to decisions based on the data and resources of the past.
Where did TMYs come from?
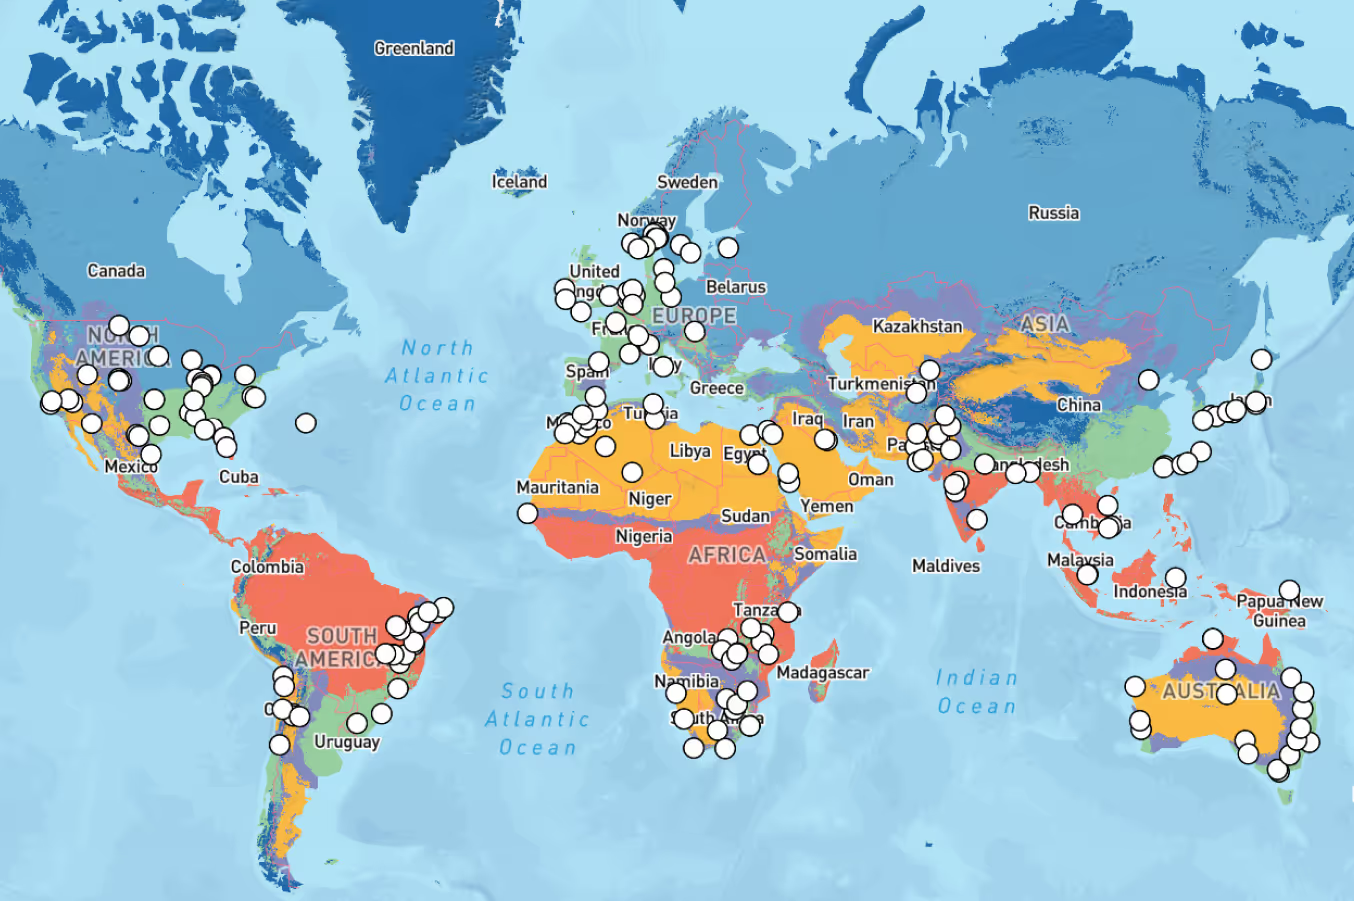
The first TMY files were created by Sandia Laboratories in 1976 for use in the US, and used data actuals from networks of weather stations from 1952-1975. In 1994, TMY2 was released by NREL (also for the US) using NSRDB data from 1961-1990. TMY3 was released in 2008, using data from 1976-2005, and PVGIS launched the first Europe TMY dataset in 2007 using data from 1985-2004. Throughout the 2010s, TMY datasets started being developed, improved and sold publicly by commercial vendors (including Solcast, Solargis, SolarAnywhere and Vaisala) based on historical time series data built using satellite and weather data derived actuals. Each commercial provider uses a slightly different, though similar, methodology so the quality of the TMY is judged on the measured accuracy of the underlying historical dataset.
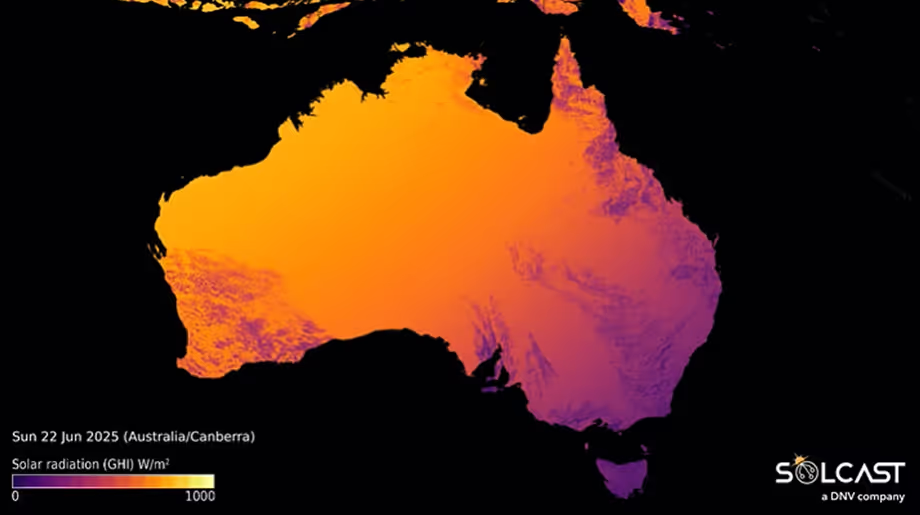
In the 50 years since TMYs were first created, there have been significant improvements in the quality of available irradiance data, and since high-quality satellite data became available - the underlying historical data used to create TMYs has been made available and validated in sub-hourly resolution. Most of the world is now covered by high-resolution satellites, which allows irradiance data providers, like Solcast and others, to create high-quality, high-resolution sub-hourly time series from 2007 to now.

Using this data, all providers of bankable irradiance data now provide both time-series and TMYs in sub-hourly formats. The widespread use of 8760 (hourly) TMY data files (also known as TMY 60M file) is primarily a result of historical availability and compatibility with industry tools, rather than a strict requirement for modeling accuracy. Solar modelling, cloud computing and weather data capabilities have improved significantly in recent decades, These files have enabled standardized workflows and manageable file sizes, but advances in data availability and computational power now allow for higher-resolution datasets that can improve the fidelity of yield modeling.
What does higher resolution data look like?
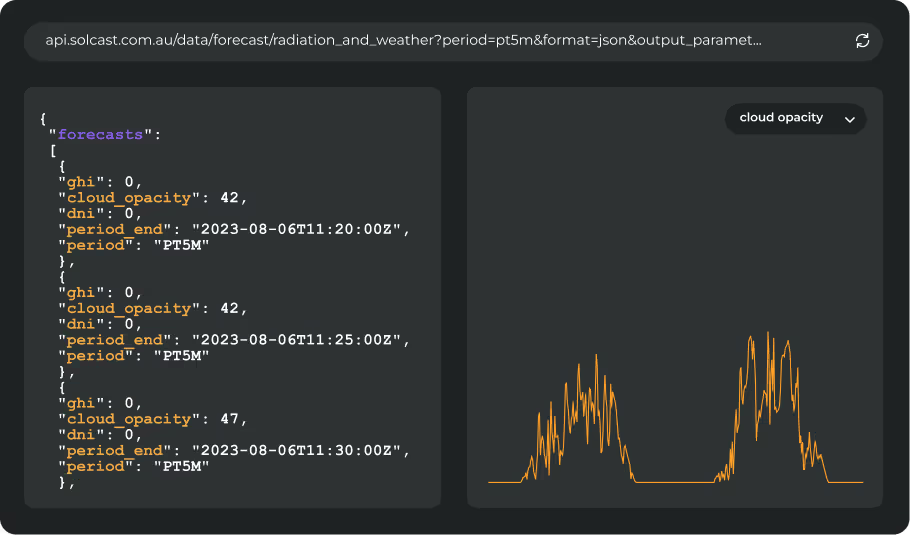
Both 60 and 15 minute data represent averages of the time period covered. Whilst this makes the data much more manageable when being manipulated manually, as can be seen in the interactive graph below, the process misrepresents data in several consistent ways:
- Hourly averaging consistently results in a ‘lagging’ curve for increasing irradiance, and a ‘trailing’ curve for dropping irradiance.
- Variable conditions, as is common in cloudy conditions, get totally smoothed out, meaning that neither peaks nor troughs are well captured.
Why sub-hourly data matters
Sub-hourly (e.g., 15-minute) TMY datasets provide a more accurate representation of real-world PV system performance. They do this in two key ways:
- Meteorological fidelity: Sub-hourly TMY data better captures variability in meteorological factors, such as rapid changes in cloud cover, which can have a significant impact on irradiance and thus on PV output. Cloud development and movement is non-linear and chaotic, so the smaller the time steps - the better for meteorological detail.
- System modeling precision: Higher temporal resolution enables more explicit modeling of system behaviors - such as inverter clipping - that hourly TMY data may miss. For example, sub-hourly data allows for a more accurate simulation of short-term peaks in irradiance that can lead to inverter clipping losses, which are often underestimated when using hourly data.
.png)
These differences are consistent across various climates and PV system types, and have been shown to result in measurable differences in modeled yield.

The financial and operational impact
Why does this matter? Because accurate yield modeling isn’t just about “bankability” — it’s about protecting your investment and managing risk. If your model overestimates yield, your assets will consistently underperform against expectations, eroding investor confidence and financial returns.
Meeting minimum industry standards is not enough. Errors in your modeling—especially those that inflate yield—translate directly into financial underperformance. By explicitly modeling derating factors with higher-resolution data, you can avoid the need for crude, blanket derating assumptions and instead minimize risk with evidence-based precision. As our Head of Data Science - Hugh Cutcher discussed in a recent webinar with RatedPower, this approach leads to more robust, defensible project valuations.
Challenging the status quo: toward better practice
The solar industry’s reliance on 8760s is a legacy of past limitations, not a reflection of today’s best available science. Cloud computing has increased our ability to manage and manipulate data by multiple orders of magnitude. Multiple bankable providers of irradiance data are now able to provide data with accuracy that approaches the quality of pyranometers. And modelling tools exist (e.g., SolarFarmer) that are capable of running long-time series, high-temporal resolution, detailed power modelling that allows the explicit, physical modelling of inefficiency and losses in solar plants.
As the evidence shows, adopting higher-resolution TMY data is not just a technical upgrade—it’s a strategic imperative for developers, asset owners, and investors who want to make decisions based on reality, not convenience.
What’s next
In part 2 of this series, we quantify the financial impact of TMY data underestimation, illustrating how small errors in yield estimation can have significant consequences for project economics.
In part 3, we’ll unpack the added complexity of the increasingly popular TMY variants: TGY, and TDY and the site-specific uncertainty in choosing between them. Also, rather than navigating this minefield, we'll show how stakeholders can bypass it entirely by transitioning to time series data.
References
Lopez-Lorente, J. et al. (2025) "The Role of Solar Radiation Ratios in Photovoltaic Asset Performance: A Global TMY Study," in 2025 IEEE 53rd Photovoltaic Specialists Conference (PVSC), Montreal, QC, Canada, pp. 0635-0639. Available at: https://doi.org/10.1109/PVSC59419.2025.11132720.
Yang, D. et al. (2024) “Regime-dependent 1-min irradiance separation model with climatology clustering,” Renewable and Sustainable Energy Reviews, 189, p. 113992. Available at: https://doi.org/10.1016/j.rser.2023.113992.
.jpg)


.avif)


