


James Luffman
August 1, 2024
Share this post
The Solcast API has been delivering over 30+ data parameters with global coverage including irradiance, PV power, soiling, albedo, plus a range of weather parameters. That's more than most solar specialist data providers, who tend to focus on the irradiance and PV power plus a few of the most solar-specific weather parameters like temperature and wind speed.
So why did we bother adding Wind Gust, Snowfall Rate and Thunderstorm Potential (CAPE) in July 2024?
Introducing Dr. Michael Foley
To help us answer this question, allow us to introduce Dr Michael Foley, a Data Scientist at Solcast since 2021. Michael previously worked at the Australian Bureau of Meteorology (BoM) firstly as a weather forecaster tracking tropical cyclones and severe thunderstorms, and later developing software for weather forecast production and verification. He has a Grad. Dip. in Meteorology from BoM, a PhD in computational chemistry from the University of Oxford, and a Bachelor of Science (Hons) from the University of Sydney.
New weather data parameters in Solcast API
The Solcast product roadmap is long and detailed, full of compelling projects and customer needs. It's not easy deciding what gets done VS what has to wait for next quarter.
How did wind gust, snowfall rate, and thunderstorm potential parameters get to the top of our list?
Dr. Foley: Although the Solcast products already included a range of weather parameters relevant to the renewable energy industry, customers were asking for more information regarding particular impactful weather which could disrupt solar production. For some customers this was to support their own operations, but in other cases it was about having more comprehensive weather data in the apps they expose to their own customers. For example, such data can be used in generating weather icons and alerts.

Dr. Foley: In the case of snowfall, we already provide a snow depth parameter, which gives the depth of the total snowpack. However, this isn’t quite the right information for people who want to answer questions such as ‘how much snow is going to fall on my solar panels, reducing their efficiency?’ To answer this, we have introduced a new snowfall rate parameter.

Inside the Data Science team: Enhancing the Solcast API accuracy
For irradiance and PV power data, plus specialised solar parameters like soiling, Solcast runs its own proprietary models with a range of inputs. In the case of these weather parameters, the primary data source is weather models (known as Numerical Weather Prediction - NWP), however there are still many important things our team needs to get right to bring you this data with the highest possible quality.
What actions does Solcast take to ensure solar data accuracy while integrating the three new weather data parameters?
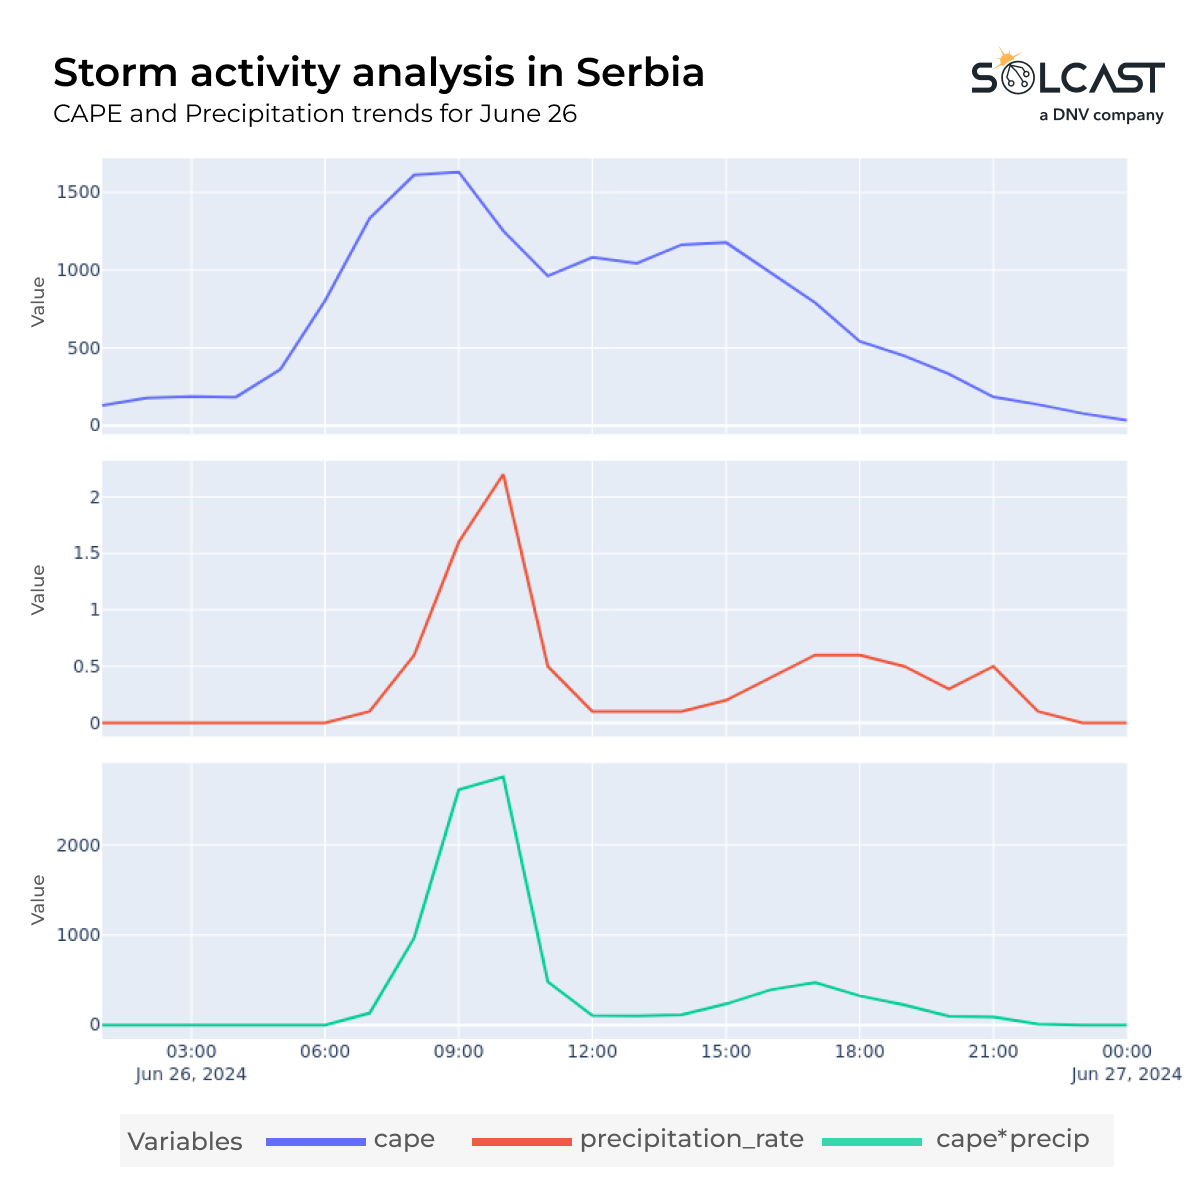
Dr. Foley: Where we take data from a variety of NWP sources, for instance from historical reanalyses and for real-time forecasts, we need to check on consistency of the data. For instance, a complicated parameter like CAPE can be calculated in various different ways, and we need to determine how CAPE has been derived in the different sources, and whether these are sufficiently aligned to use across Solcast’s products.
Although we were able to source snowfall rate from both historical and real time forecast NWP, a catch was that it was in units of ‘water equivalent depth' i.e. the amount of liquid water you would get if you melted all the newly-fallen snow, while it is the depth of solid snow that matters to solar producers. To supply the solid snow depth, we explored some published models of the density of newly fallen snow - which can depend on things like temperature, wind speed and humidity - to find a suitable scheme to use for our snowfall rate calculation.
Working out what to use for the new parameters is only half the job. The other half is the technical side of implementation: incorporating the new parameters into our production pipelines, and thoroughly testing them through to the Solcast product suite. I worked carefully with our software development team to dot all the ‘i’s and cross all the ‘t’s, so that the data can be reliably available to our customers.
Weather and irradiance data built for solar
Adding Wind Gust, Snowfall Rate, and Thunderstorm Potential to the Solcast API provides more comprehensive and accurate weather data for our users. These new parameters will enhance our customers' ability to manage their solar operations and make timely decisions for their assets.
Try using these new weather data parameters when you sign up for a commercial toolkit. Or talk to our team to learn more.