January’s atmospheric conditions led to variations in solar conditions across North America. High pressure anomalies over the West Coast and Rockies brought solar gains but also increased wildfire risks. The Midwest also saw above-average irradiance, while Canada and the Gulf Coast saw declines due to increased cloud cover. According to analysis using the Solcast API, ISO New England and PJM outperformed long-term trends in capacity-adjusted performance, whereas ERCOT performed only slightly above average.

The West Coast and Rocky Mountains saw irradiance levels up to 20% above the January average. A dominant high-pressure system over the North Pacific played a key role, keeping storm systems offshore and directing dry, northerly winds over much of the western United States. This pattern led to reduced cloud cover and suppressed rainfall, significantly boosting solar potential. However, these same conditions also contributed to severe and destructive wildfires in California.
In the Midwest, irradiance levels were well above average, with areas south of the Great Lakes seeing values up to 30% higher than a typical January. This increase was driven by a cold but relatively dry northerly air mass that moved over the region. As a result, skies cleared more quickly than usual following snowfalls, allowing for more sunlight to reach the ground.

This solar surge led to increased production for US grids with ISO New England achieving 28.9% while PJM seeing a 21.6% rise, both compared to January average values from 2007-2024. While January is typically a low-irradiance month, colder temperatures helped to boost the efficiency of solar panels, partially mitigating the seasonal dip in solar generation.
Further south, the Gulf Coast experienced near-average to below-average irradiance, with the western portion of the region particularly affected. This was due to increased convective cloud cover which reduced solar potential. As a result, ERCOT saw only a marginal irradiance benefit of 1.43% above average, as its weather patterns remained relatively stable compared to the dramatic shifts further north.

Meanwhile, much of Canada saw below-normal irradiance, which is already low during this time of year due to the sun’s low position on the horizon. The combination of increased cloudiness and limited daylight hours resulted in one of the least favorable regions for solar generation in January.
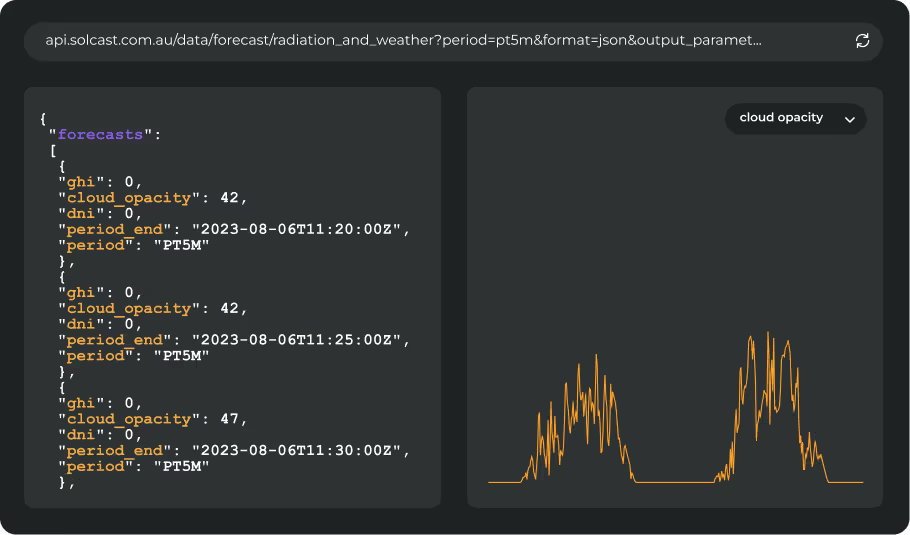
Track weather conditions, cloud movements, and irradiance-influencing factors that impact your solar generation. Access bankable actuals and accurate forecasts when you sign up for a Solcast API toolkit. You can reach out to our team for an extended trial.


.avif)


