


Typical Meteorological Year
Download a statistically representative “typical year” file built from 15 + years of satellite data for long-term yield modelling.
Global irradiance and weather data records designed and built for solar and cleantech
Source: Solcast API, Solar Assets from Global Solar Power Tracker, Global Energy Monitor, Bankability Site Data from DNV
*Private site locations are approximated to another location in the same region and climate zone


_Frame.png)


The world's most accurate historical irradiance and weather data. 20+ weather parameters tailored to solar energy applications, from 2007 to 7 days ago. Available in JSON via synchronous API, or instant CSV web download.
Designed for solar, from the ground up. Never rely on generic weather model data again. Solcast's real time and forecast data tracks and forecasts real clouds at a resolution of 1-2km and 5 minutes. Our irradiance data and PV power data is updated every 5 minutes, downscaled to 90 metre resolution. Aerosol and albedo effects are explicitly treated.

Access high resolution weather and irradiance data for anywhere in the world.
Weather data from leading reanalysis datasets completes the full suite of 20+ parameters available at 5, 10, 15, 30 and 60 minute resolutions. Coverage from 2007 to 7 days ago.
Be confident that our data is fit for purpose.
Our team of data scientists and meteorologists are committed to accuracy and transparency. That's why we publish our results site-by-site so you can understand and trust our data. See our bankability validation to review global, regional or climate zone results and understand indicative performance.

Synchronous API returns JSON data in 1-5 seconds per request, and requests can be submitted in parrallel up to your account rate limit.
Web downloads for up to 20 locations at at time. Choose from multiple file types including CSV, ready to use in your favourite simulation software.
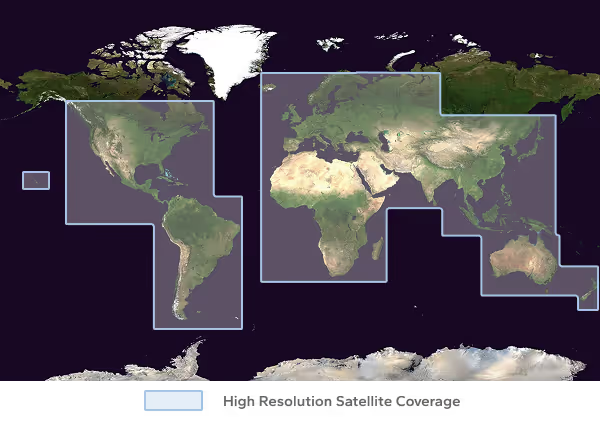
Geographic covereage
Global (note: far ocean and polar regions are coarser resolution)
Temporal coverage
January 2007 to 7 days ago (for past 7 days to present time and forecasts, use our Live and Forecast data)
Temporal resolution
5, 10, 15, 30 & 60 minutes (period-mean values)
Spatial resolution
90m (irradiance, PV power, snow soiling and cloud parameters, over all non-polar continental areas and nearby islands)
27km (other parameters, and polar or remote oceanic regions)
Data parameters
The following data parameters are available.
+
Irradiance parameters
^ Clear-sky scenarios also available for these parameters
+
Solar parameters
^ Clear-sky scenarios also available for these parameters
+
Wind parameters
+
Weather parameters
Data access
API or Web download
Download wait time
API: synchronous requests. Web download: seconds.
File formats
CSV, JSON, PVsyst, SAM, TMY3
Data formats
Solcast standard, PVsyst (60 minute only)
Time zone
UTC, longitudinal, or user-specified fixed offset.
Forecasts are crucial in optimizing renewable power plants with predictive controls. Solcast’s forecasts, and the resulting decisions we make with them, are front and center for our operators.

As far as we know, there's no provider that can provide a more accurate forecast.

Adding Solcast's weather data in our hydrogen storage systems improved our control strategy that responds well to weather patterns.

On top of our sophisticated solar modelling, Solcast's accurate data has elevated what we already have and allowed us to expand to new geographies.

Solcast's "Estimated Actuals" closes the gap for our owned and third-party solar portfolios.
Accurate real-time and forecasted weather data is crucial for assessing plant performance and maximizing the value of clean energy assets.

Leave your details and one of our team will be in touch.
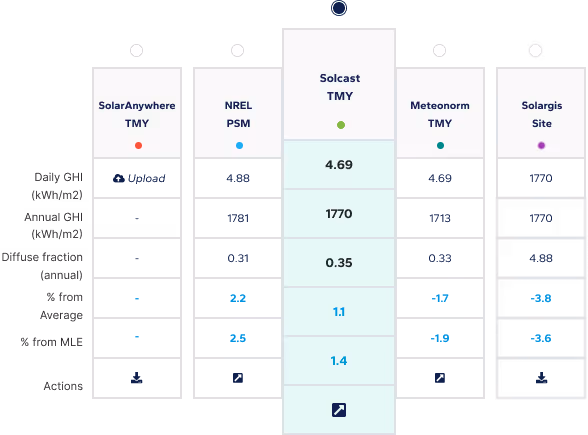
Check how our Historical Time Series data compares with other irradiance and weather data.

Download a statistically representative “typical year” file built from 15 + years of satellite data for long-term yield modelling.
Compare multiple satellite data sets side-by-side to choose the most bankable resource file for your site.

Bankable 3D-aware PV yield simulations, from automated layout to sub-hourly energy outputs, all in one streamlined tool.
What is historical irradiance data?
Historical solar irradiance data is the recorded measurements of solar energy received at a specific location over many years. Solcast’s historical data covers from 2007 to 7 days ago. Historical irradiance data will include several irradiance parameters, including Global Horizontal Irradiance (GHI), Direct Normal Irradiance (DNI), Diffuse Horizontal Irradiance (DHI), and Global Tilted Irradiance (GTI), also known as Plane of Array irradiance (POA). Irradiance is measured in energy per unit area over a period of time. Historical solar irradiance data is essential for performance analysis of existing solar installations, and planning future solar projects’ feasibility and performance.
How is historical time series data generated?
Solcast's historical time series data is generated through a combination of satellite observations and weather models. These inputs are then fed into advanced modeling algorithms and calibrated with high-quality site measurements to create high-resolution, high-accuracy historical solar irradiance data. Learn more about Solcast’s irradiance methodology here.
What is average daily solar irradiance and when to use it?
Average daily solar irradiance is the average energy of solar radiation received per day at a location. It is often measured in kWh/m²/day. It can be presented as the average daily solar irradiance per month, or per year. This metric is useful for energy production estimates.
Why is historical time series useful for forecasting?
Historical time series is crucial for forecasting because it provides a baseline of past patterns and trends, including seasonal variations, deviations, and anomalies. By using Solcast's bankable historical data, you can develop predictive models that accurately forecast expected solar irradiance which is beneficial for grid management, energy trading, and asset operational planning.
Subscribe to our newsletter to keep up to date with all the latest news.