


.avif)


Historical Time Series
Access sub-hourly irradiance and weather records from 2007 to today for validation, machine-learning, and grid studies.
TMY data for solar energy simulations and yield analysis


_Frame.png)


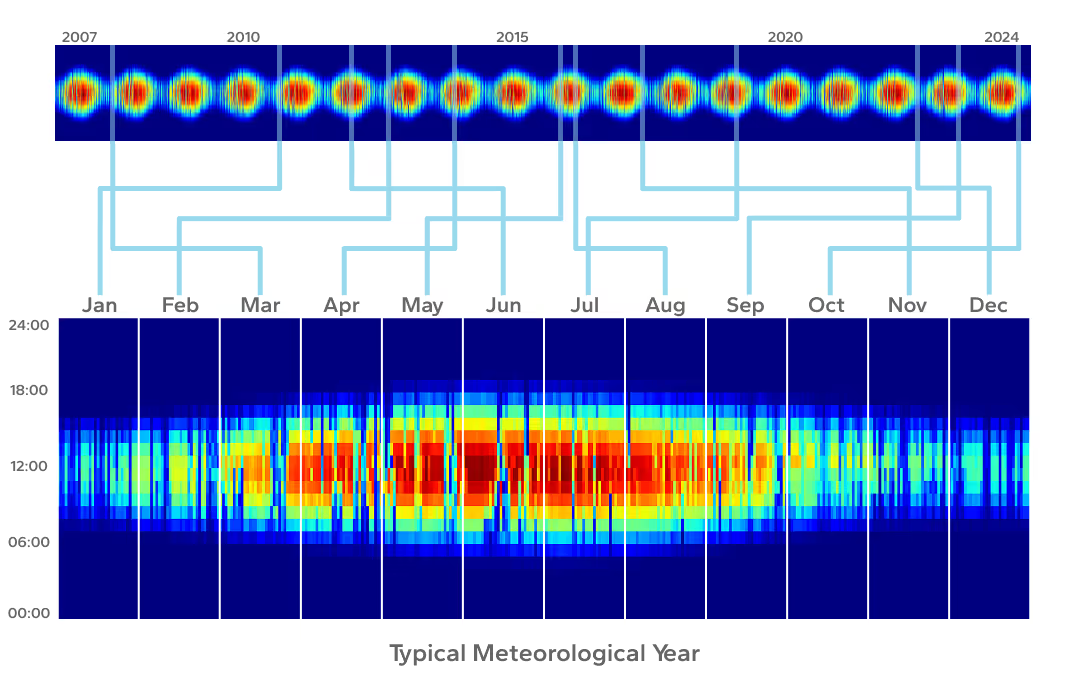
A collation of historical weather data derived from a multi-year time series selected to present the unique weather phenomena with annual averages that are consistent with long term averages.
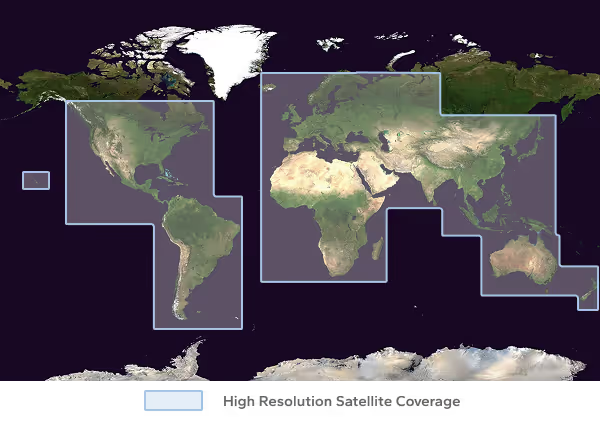
Designed for Solar, from the ground up. Never rely on generic weather model data again. All of Solcast's bankable irradiance data is based on high-quality satellite data that tracks real clouds at a resolution of 1-2km and 5 minutes. Aerosol and albedo effects are explicitly treated, with parameters downscaled to 90m resolution globally.

Solcast TMY files are available directly in SolarFarmer, PVSyst, SAM, PlantPredict, Solesca and PV*Sol and several more, as well as DNV's Solar Resource Compass. SDK's are available in several languages for use in your own notebooks, and all other modelling platforms are supported through via industry standard data formats including CSV and JSON.
Direct API download for TMY P50 data. TMY PXX scenarios (P75, P90, P95) downloads through the Solcast API Toolkit. Multiple file types supported (CSV, PVsyst, TMY3, SAM).
.avif)
Full suite of weather data from leading reanalysis datasets completes the collection of 20+ parameters available.
TMYs are built of data coverage from 2007 to 7 days ago, from hourly to 15 minute resolution, and both the TMY methodology and underlying data quality have been validated in a 207 site DNV bankability study.
Geographic covereage
Global (note: far ocean and polar regions are coarser resolution)
Temporal coverage
TMYs are constructed from historical data from 2007 to the last complete calendar year.
Temporal resolution
15, 30 & 60 minutes (i.e. 8760)
Spatial resolution
90m (irradiance, PV power, snow soiling and cloud parameters, over all non-polar continental areas and nearby islands)
27km (other parameters, and polar or remote oceanic regions)
Data parameters
The following data parameters are available.
+
Irradiance Parameters
+
Solar Parameters
+
Weather Parameters
^ Clear-sky scenarios also available for these parameters
Data access
API or Web download
Download wait time
API: synchronous requests. Web download: seconds.
File formats
CSV, JSON, PVsyst, SAM, TMY3
Data formats
Solcast standard, PVsyst (60 minute only)
Time zone
UTC, longitudinal, or user-specified fixed offset.
Forecasts are crucial in optimizing renewable power plants with predictive controls. Solcast’s forecasts, and the resulting decisions we make with them, are front and center for our operators.

As far as we know, there's no provider that can provide a more accurate forecast.

Adding Solcast's weather data in our hydrogen storage systems improved our control strategy that responds well to weather patterns.

On top of our sophisticated solar modelling, Solcast's accurate data has elevated what we already have and allowed us to expand to new geographies.

Solcast's "Estimated Actuals" closes the gap for our owned and third-party solar portfolios.
Accurate real-time and forecasted weather data is crucial for assessing plant performance and maximizing the value of clean energy assets.

Leave your details and one of our team will be in touch.
See the DNV review of Solcast's irradiance and TMY methodology.
.avif)
Access sub-hourly irradiance and weather records from 2007 to today for validation, machine-learning, and grid studies.
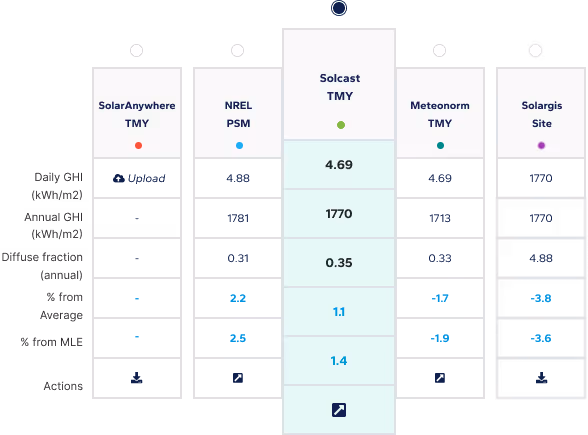
Compare multiple satellite data sets side-by-side to choose the most bankable resource file for your site.

Stream high-resolution, real-time irradiance and PV power data, updated every 5 minutes, for operational decision-making and grid visibility.
What is TMY data?
TMY, or Typical Meteorological Year, data is a year-long synthetic historical time series that has realistic physical variation in irradiance and that matches expected long-term total solar irradiance. In solar applications, accurate, bankable TMY data representing typical irradiance years are used for modeling and simulating the performance of assets under typical weather conditions.
How is a TMY calculated?
TMY data is calculated by analysing and combining real periods from a multi-year dataset based on statistical criteria to create a synthetic year that reflects typical weather conditions. Solcast’s TMY API selects representative periods to match the long-term average historical irradiance, and includes key weather parameters including multiple solar irradiance measures, temperature, overall climate conditions, and even albedo and aerosols. Check our irradiance methodology.
When should I use TMY over historical time series (TMY vs Time Series)?
TMY data is preferred for project financing, and is useful for representing weather conditions that vary every single day. Historical time series data is best when analysing long term weather trends (like snow soiling), correlation of weather with other circumstances (like energy prices) or variation and risk over time. TMY data is ideal for designing and optimising assets, bankable energy assessments for project financing, and performing long-term energy yield projections.
What does bankable mean in solar?
While a viable solar project may be feasible and potentially profitable, a bankable solar project meets stricter criteria required by financiers, including extensive risk assessments and credible performance data. Being bankable means that a project is considered reliable and financially sound to secure funding from investors or lenders. So, it’s important to choose globally validated, bankable TMY and historical data when doing solar resource assessment. Check how the Solcast data compares with other historical irradiance data providers, or use DNV's Solar Resource Assessment tool to make the comparison.
What is TMY P50 and P90?
P50 and P90 are probabilistic scenarios, used for managing and understanding the risk of variable weather conditions, where the number denotes the percentage of years that will exceed that value. For due diligence and solar resource assessment, having multiple probabilistic scenarios is beneficial for better decision making and risk management. TMY P50 represents the median or average conditions, reflecting typical long-term weather patterns while TMY P90 represents a more conservative “low end” scenario, indicating conditions that are exceeded 90% of the time, used to understand the downside risk of a “bad year”. Solcast offers probabilistic scenarios for TMY at any “Pxx” level.
Subscribe to our newsletter to keep up to date with all the latest news.