


Harry Cheselwoods
August 29, 2023
Share this post
Solar generation capacity in the US continues to increase, which makes understanding the climatic variations that impact production crucial for asset owners, operators and the grid. As the current El Niño intensifies, solar stakeholders are considering the impact this will have on US solar production through the upcoming winter.
Long term solar production forecasts are challenging and inherently uncertain, which is why Solcast’s data stops at 14 days ahead. Whilst it’s impossible to produce an accurate forecast for any given day in the upcoming winter, historical analysis of recent El Niño events can shed light on potential effects on North American solar portfolios. This analysis uses data from our Historical Time Series product, via the Solcast API.
The 2023-24 El Niño event
The National Oceanographic and Atmospheric Administration (NOAA) has declared that we are in an El Niño event, and that there is a 90-95% probability this will continue into the upcoming winter.
El Niño events typically develop to maturity during the fall, and as such NOAA has further forecast a 56% chance that this will be a “strong event”. Certainly the current (late August 2023) sea surface temperature anomalies already show a strong El Niño signature, stronger than the last two events at this time of year.
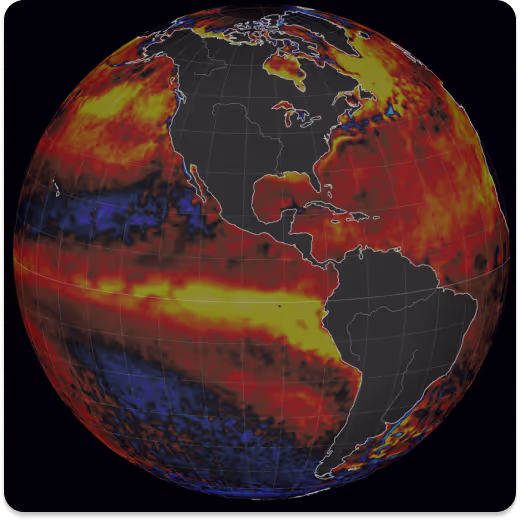
Sea Surface Temperature anomalies from long term average, August 27th 2023. Yellow areas are more than 3°C above average.
Source: NOAA. Plot by earth.nullschool.net
How does El Niño affect North America’s climate during winter?
The “ENSO” mode of variability (of which El Niño is one extreme) is the largest single climate driver on earth on the timescale of years, causing large differences in climate between one year and another for large areas of the earth. ENSO is the dominant mode because it happens in the largest ocean basin, the Pacific. El Niño events occur when unusually warm sea water masses around the tropical eastern Pacific, closer to the Americas, and this usually develops during the fall. In North America, El Niño events tend to have the biggest impacts during wintertime, when the events are at their peak maturity. According to NOAA's climate.gov:
“As El Niño heats the atmosphere above the central and eastern tropical Pacific, it leads to a stronger Hadley circulation and changes to the jet streams. For example, in an El Niño winter, an extended North Pacific jet stream tends to bring more storms across the southern tier of the U.S. and warmer air to the northern half of North America.”
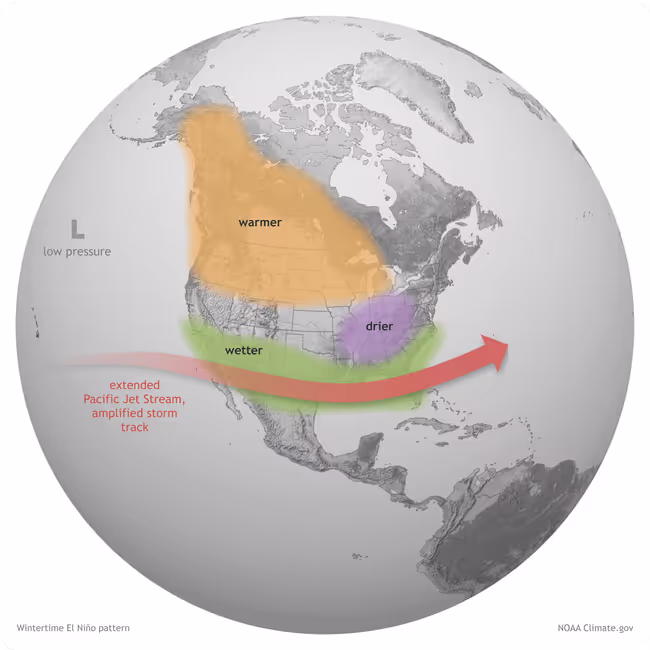
Schematic diagram of wintertime changes to atmospheric climate over North America.
Source: NOAA Climate.gov Blog
What does El Niño mean for wintertime solar production compared to normal?
So that’s general climate impacts, but what about solar? Solcast has analyzed its own wintertime irradiance data over North America during previous El Niño events (2006-07, 2009-10, 2014-15, 2015-16 and 2018-19), to show the historic impact on global Horizontal Irradiance (GHI). This chart shows a comparison of the average GHI in the El Niño episodes versus the long term average.
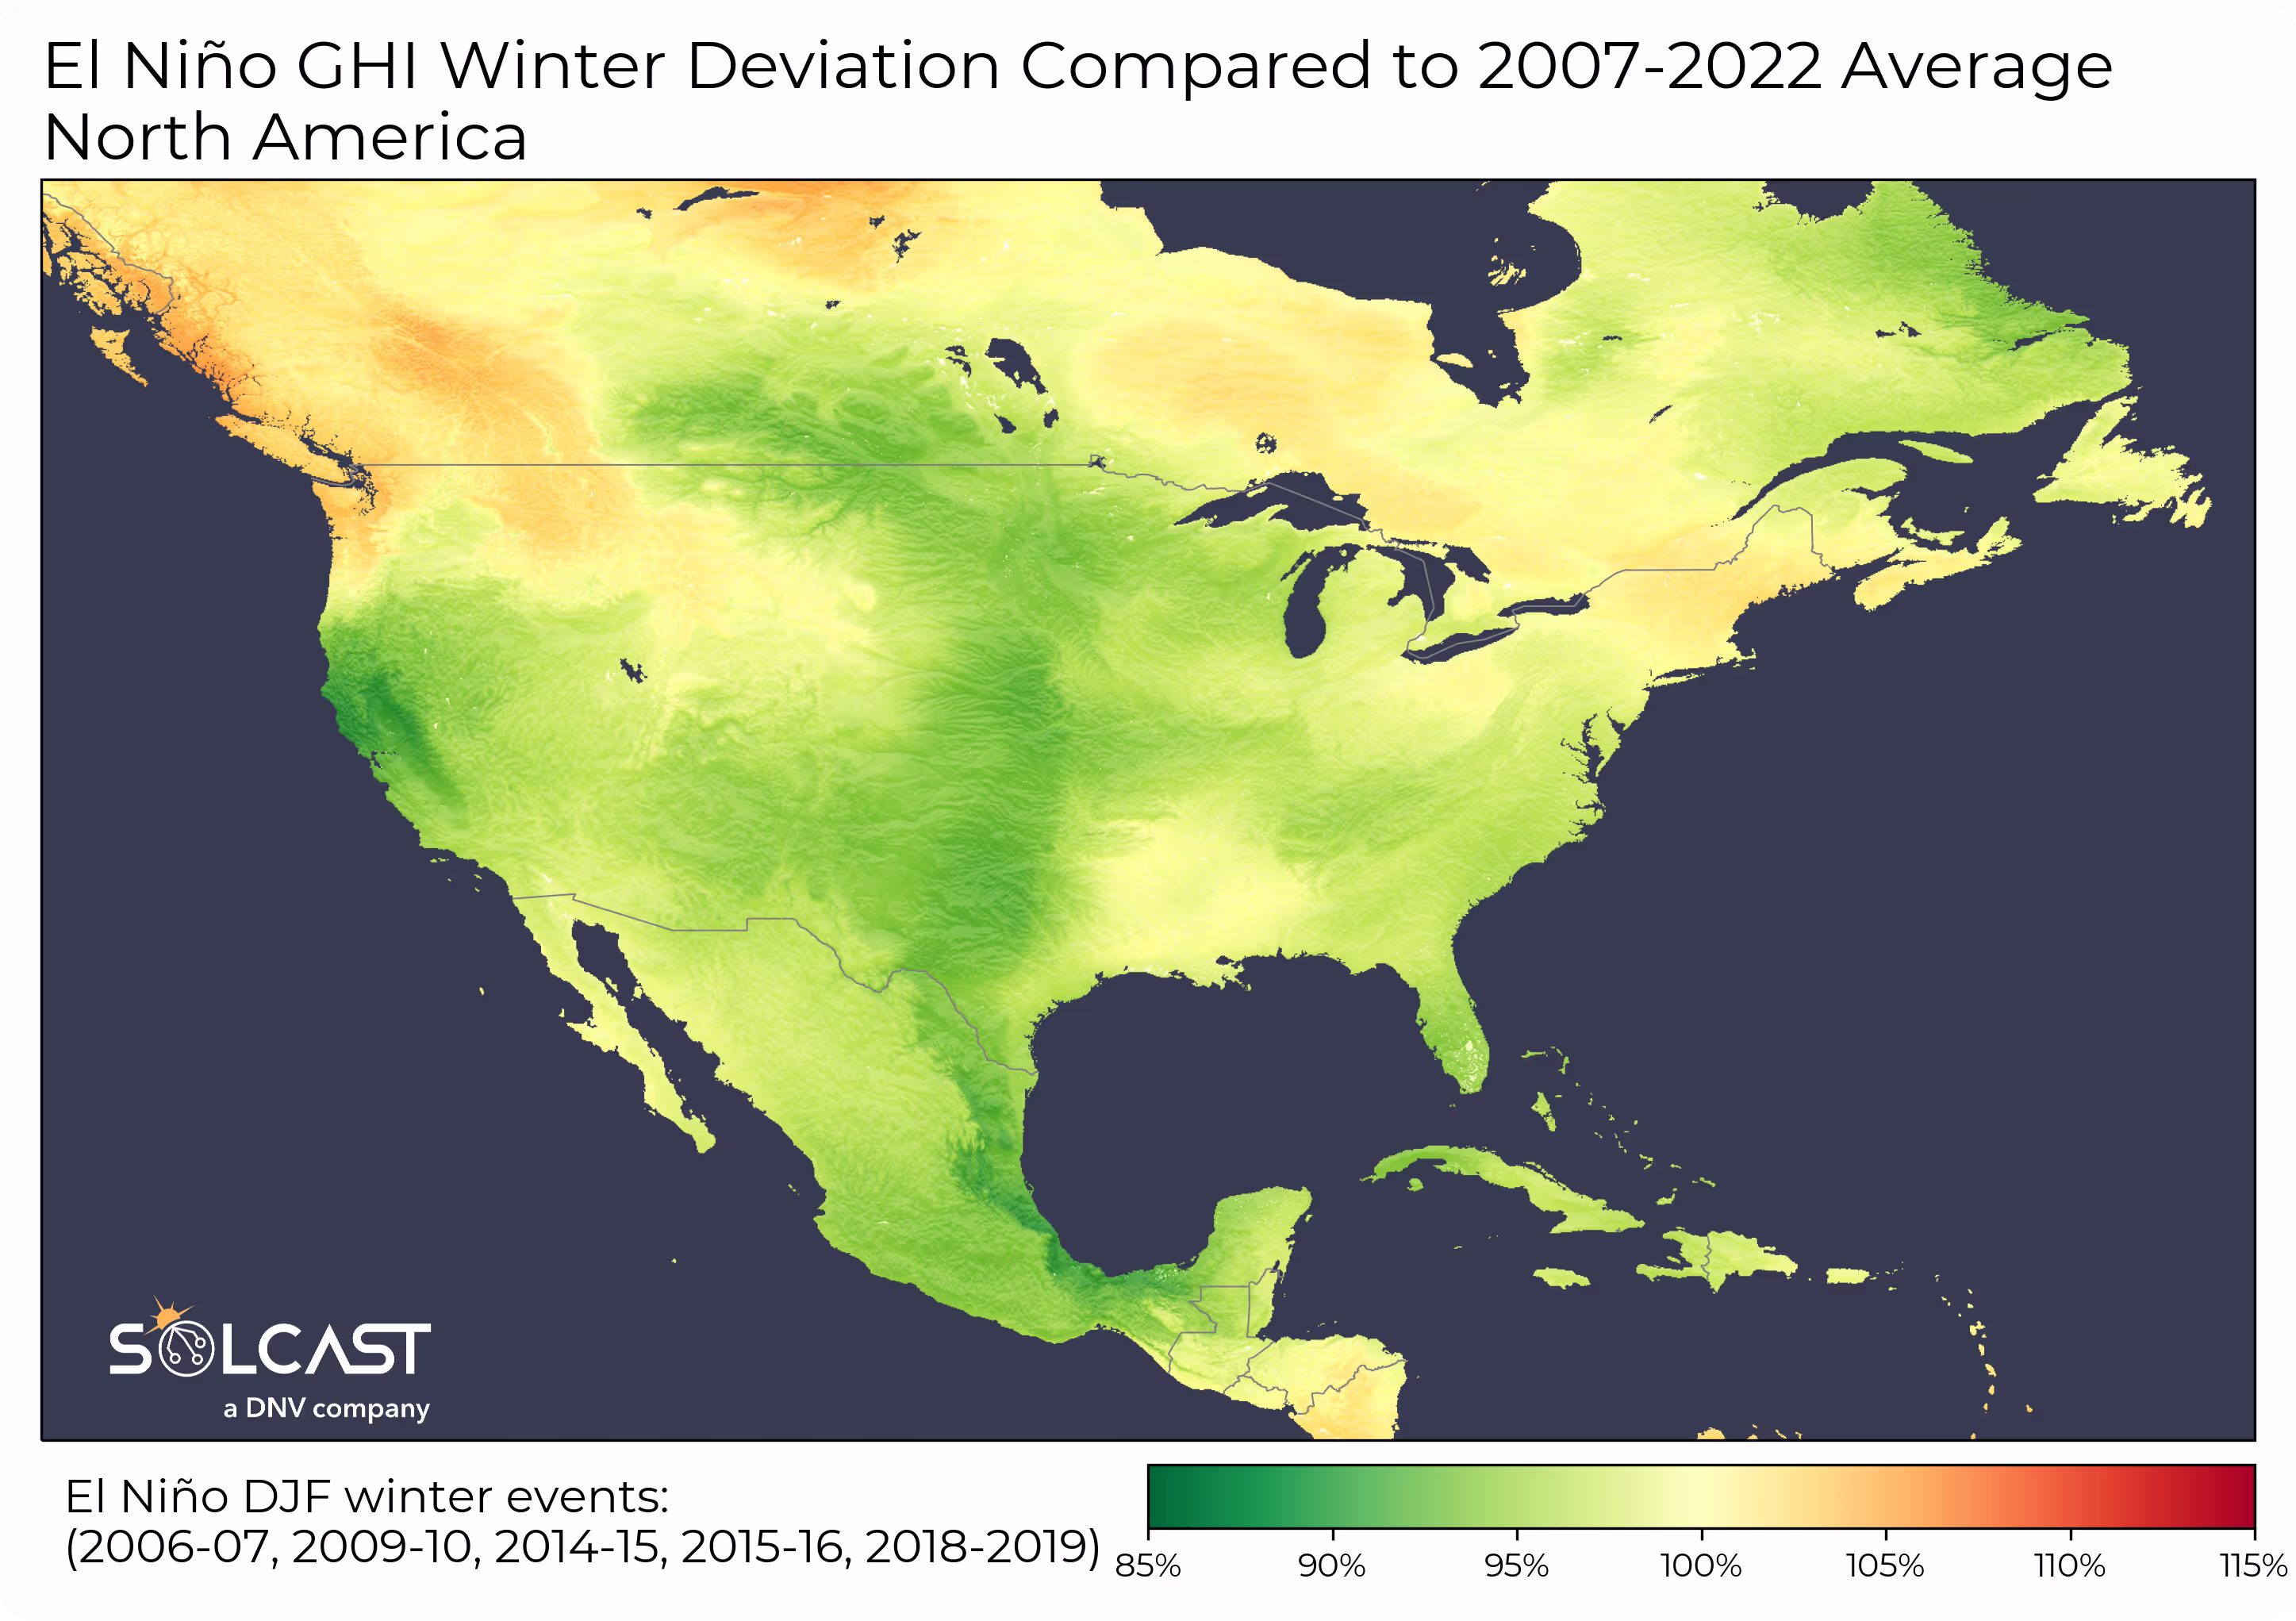
Analysis of GHI in December, January, and February in El Niño years compared to long term average.
Source: Solcast API
Average irradiance deviation during El Niño winters
During El Niño winters, large areas of the continental US have a tendency to experience reduced irradiance. California, the Southwest, Midwest, Southeast, and Mexico in particular see cloudier conditions compared to average. Conversely, large areas of the Pacific Northwest and Canada tend to receive above-average irradiance.
This is on average across the past five El Niño winters, and of course individual winters can vary significantly. To get a sense for the possible character of the 2023-24 El Niño, we can look at the seasonal forecast from the European Centre for Midrange Weather Forecasting (ECMWF). This is a forecast of precipitation, which is highly correlated with cloudiness (though not perfectly). As you can see, it’s the south and east of the continental US, and Mexico, where the likelihood of wetter (and probably cloudier) conditions is highest.
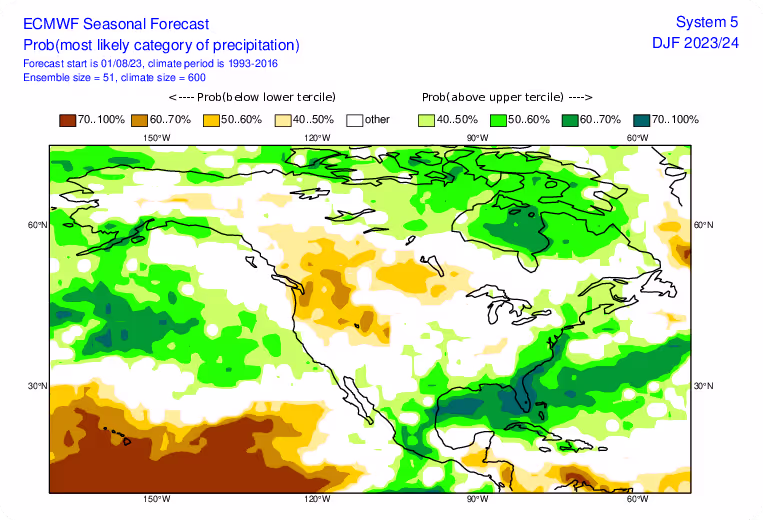
Forecast of wintertime precipitation departures from normal.
Source: ECMWF Seasonal Forecast
Does this forecast mean that California, Arizona and the Midwest may be spared from the solar impacts of this El Niño? And that the Pacific Northwest and Canadian Prairies can expect a bumper year for solar production? Possibly, but it’s very early days yet, and seasonal forecasts like this one from ECMWF tend to change and also become more accurate as their time horizon shortens.
What about compared to last winter?
To help understand how this winter’s solar production may be different from last winter, which is a relevant comparison for many operating solar assets, we have also compared the El Niño winters to last winter. When we do this, the differences get much starker. The differences are larger in magnitude partly because we’re only comparing to a single winter, rather than a long-term winter average, and therefore partly we’re seeing specific details of last winter. Winter 2022-23 was cloudier than average for the West Coast, Rockies and Great Lakes, and sunnier than average for the Midwest, Florida and Mexico.
.avif)
Analysis of GHI in December, January, and February in El Niño years compared to 2022-2023 Winter.
Source: Solcast API
Average irradiance during El Niño winters compared to the 2022-23 winter
The above-average irradiance signal over the Pacific Northwest, British Columbia and Alberta grows in magnitude, since last winter was particularly wet and cloudy there, compared to the El Niño winters which tended to be sunnier there. The US Rockies and Arizona also see an uplift for El Niño winters compared to last winter, since their last winter was also cloudier than average.
Conversely, the Midwest, Florida and Mexico all see a drop in irradiance for El Niño winters compared to last winter. This drop is due to the combination of the cloudy El Niño signal, combined with last winter being sunnier than normal for these regions.