


Dr. Hugh Cutcher
March 19, 2025
Share this post
North America’s solar irradiance patterns in February followed a weak La Niña-like distribution, with moderate deviations from average irradiance. Most of Mexico and the Southwest saw above-average irradiance, while the Pacific Northwest and Great Lakes had cloudier conditions that reduced solar potential. In the East, winter storms further lowered irradiance, but the Northeast avoided the worst effects and saw sunnier-than-average conditions.
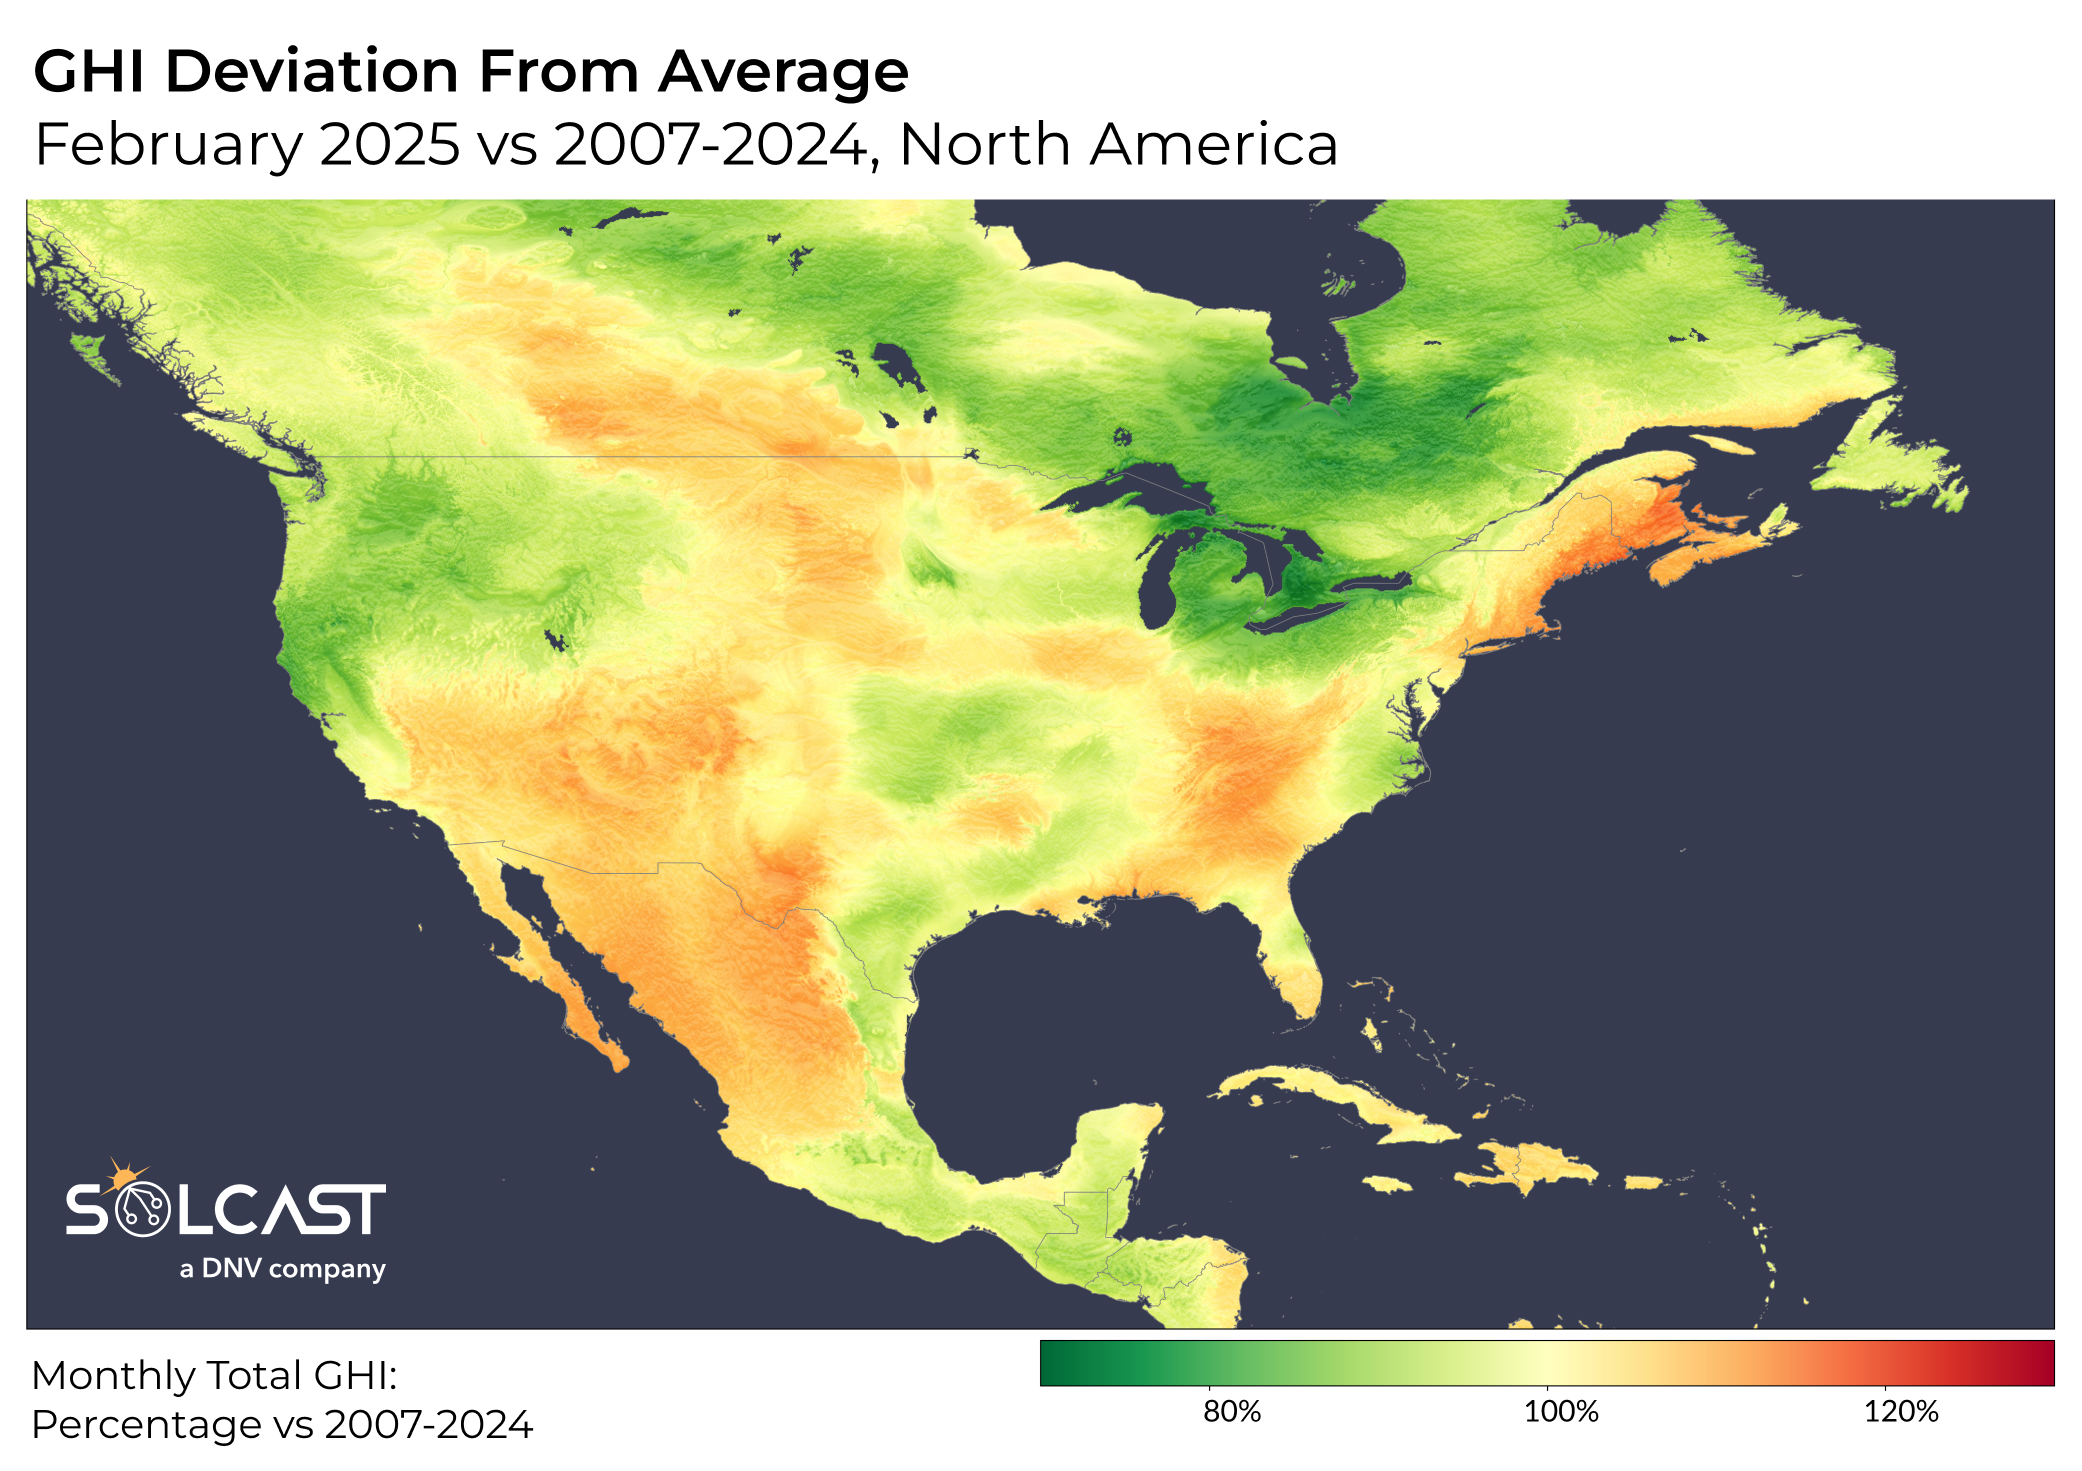
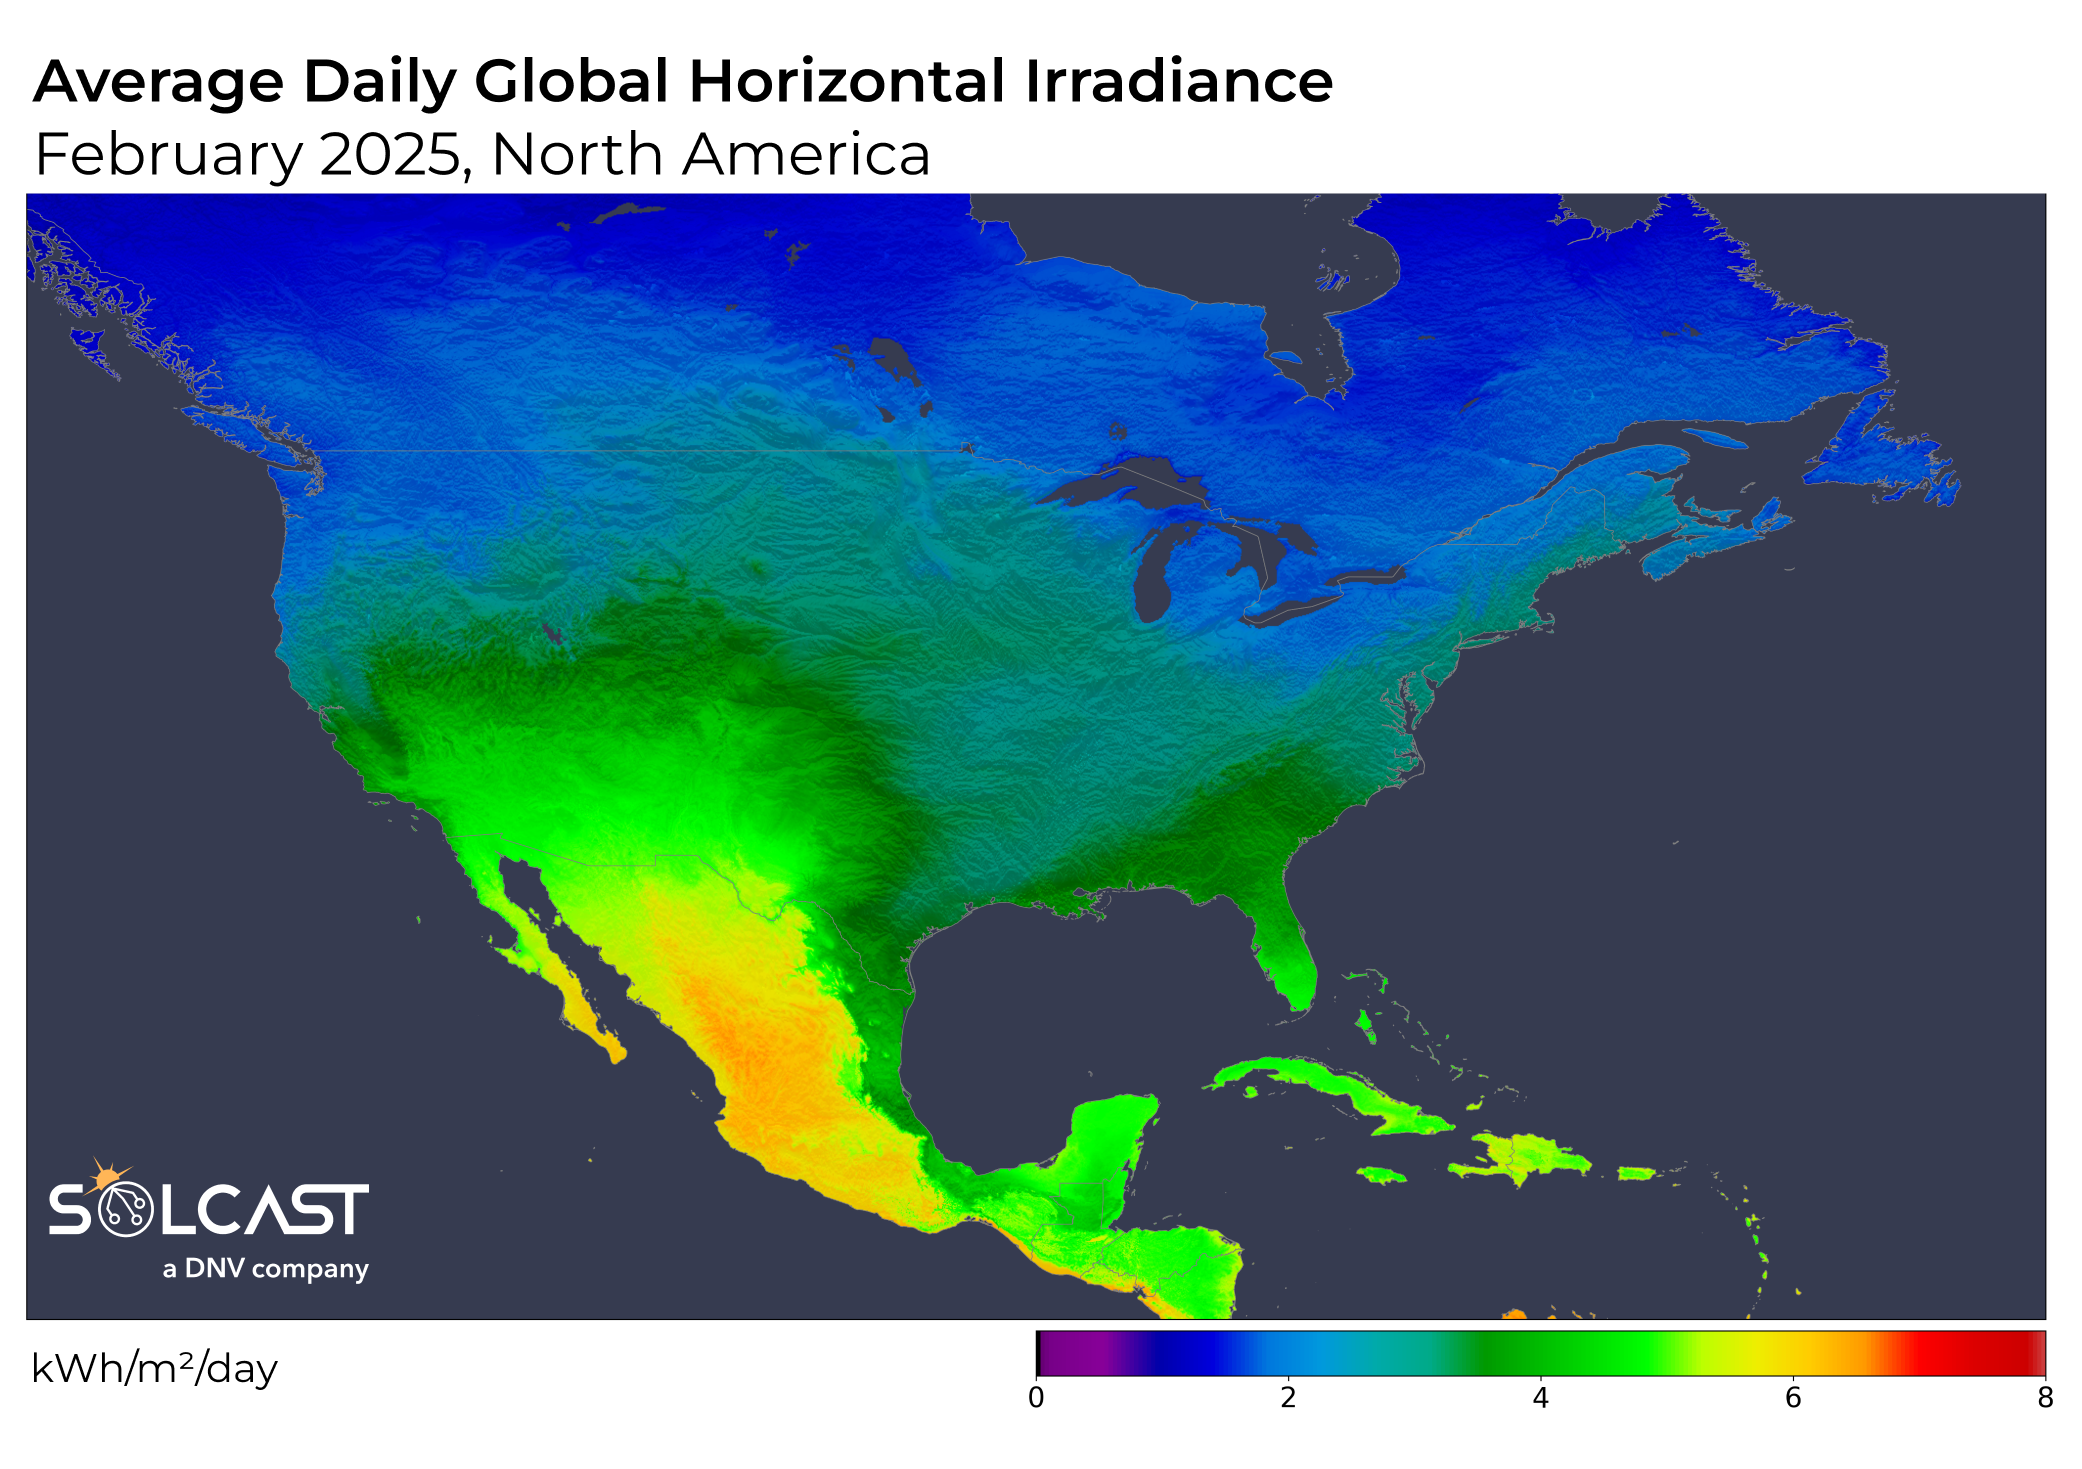
The overall irradiance distribution reflected the influence of the weak La Niña pattern that emerged in the tropical Pacific during 2024 and persisted into early 2025. Mexico benefited from favorable conditions for PV generation, with average daily irradiance exceeding 5 kWh/m², and regions north of Mexico City seeing a 10% increase above historical norms. This sunnier-than-average trend extended northward into Arizona, New Mexico, Nevada, Colorado, and southern Utah, all of which recorded similar above-average irradiance levels. Western Canada also experienced sunnier conditions than usual, though the seasonal constraints of winter kept daily irradiance modest at just over 2 kWh/m².
.png)
By contrast, and in line with winter La Niña patterns, California and the Pacific Northwest faced unfavorable conditions for solar generation, with persistent moisture-laden air off the Pacific leading to increased cloud cover and precipitation. Irradiance levels were 10% below average in these areas. The Great Lakes region fared even worse, with irradiance dropping by 15%, reflecting increased cloudiness and snowy conditions.
In the east, winter storm systems played a key role in shaping solar conditions. Ontario and Quebec were hit by multiple polar air masses that carried major winter storms, leading to irradiance levels 20% below their already low seasonal averages. A coastal low-pressure system brought a mix of rain, snow, and sleet to the Carolinas. This contributed to irradiance being reduced by 5-10% over the month. However, the far Northeast largely avoided these winter storm impacts, seeing sunnier-than-usual conditions. New Hampshire, Maine, and New Brunswick all recorded irradiance levels 10-15% above average, offering a modest boost to PV generation for ISO-NE.
Track weather conditions, cloud movements, and irradiance-influencing factors that impact your solar generation. Access bankable actuals and accurate forecasts when you sign up for a Solcast API toolkit. You can reach out to our team for an extended trial.