


Typical Meteorological Year
Download a statistically representative “typical year” file built from 15 + years of satellite data for long-term yield modelling.
Probabilistic MW-scale grid forecasts engineered for grid-wide accuracy


_Frame.png)


Market & Portfolio Models fuse live SCADA, 1–2 km satellite irradiance and NWP ensembles to generate kW/MW time-series at 5- to 60-minute resolution complete with P10/P50/P90 uncertainty bands out to 14 days. Traders, ISOs and utilities rely on these physically informed machine-learning models for optimal dispatch, hedging and DER planning.
Turn hundreds of thousands of rooftop and utility PV systems into a single grid forecast for any ISO zone, feeder or VPP. Solcast Grid Aggregations blend 1–2 km satellite imagery with advanced PV models to create real-time estimated actuals and 5- to 60-minute grid and behind-the-meter forecasts, refreshed every five minutes.
Probabilistic P10/P50/P90 outputs and custom geographic boundaries give operators the visibility to model underlying demand, sharpen load forecasts, flag minimum-demand events and cut congestion risk.
Probabilistic fleet forecasts for solar & wind
Our model already supports 2,000+ sites (150 GW) across 20 countries, producing accurate power for individual projects or entire portfolios. Machine-learning and physical models fuse live SCADA feedback with global weather ensembles, delivering deterministic and probabilistic outputs every 5–60 minutes for horizons up to 15 days.
By turning weather uncertainty into probabilistic MW curves, you can bid nearer to true output without breaching risk limits.
Leave your details and one of our team will be in touch.
Dive straight into our API Toolkit, access the models or test our Historical Time Series, Live, and Forecast data

Download a statistically representative “typical year” file built from 15 + years of satellite data for long-term yield modelling.
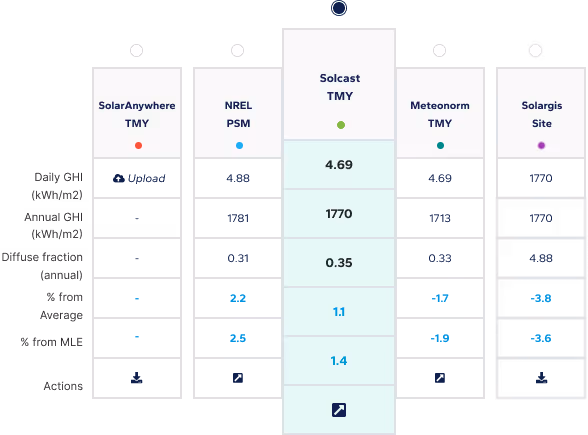
Compare multiple satellite data sets side-by-side to choose the most bankable resource file for your site.

Bankable 3D-aware PV yield simulations, from automated layout to sub-hourly energy outputs, all in one streamlined tool.
Which model does Solcast use for behind-the-meter solar forecasts?
Solcast uses proprietary models built for each grid or system based on available data in the production of our behind-the-meter solar Grid Aggregations data product. This product provides estimated actual and grid forecast production data for network assets or grid regions of any size, based on public or proprietary data. Solcast can create custom behind-the-meter solar and grid forecasts for system operators on request.
How frequently are behind-the-meter solar forecasts updated and delivered?
For behind the meter solar, Solcast provides live and forecast data via API, refreshed every 5–15 minutes for grid aggregations. Forecast horizons extend up to 14 days ahead, with probabilistic outputs (P10/P50/P90) available for improved risk management. Data can be accessed in JSON or CSV formats through REST API or web toolkit.
How far ahead do the forecasts extend?
Our live-plus-forecast feeds cover up to 14–15 days ahead, with up to seven days of recent history, depending on the service tier.
How often are the model outputs refreshed?
Update intervals are configurable down to 5 minutes; Solcast grid aggregations refresh every 5–15 minutes, while Forecaster offers frequencies from daily to 5-minute resolution.
What geographic coverage is available?
The aggregation models generate data for virtually any land area worldwide (global, except ocean and polar regions) using 1–2 km satellite imagery and numerical weather-model inputs.
Which variables and uncertainty metrics can I access?
Outputs include aggregated PV power in MW with P10, P50 and P90 probability bands; Forecaster also supplies probabilistic power forecasts for wind, solar or demand.
How are the forecasts delivered?
Data streams via REST API, SFTP or email and are available in JSON or CSV through the Solcast Web Toolkit.
Can I evaluate the models before subscribing
Yes. Solcast lets new users make up to ten free live and forecast API calls, and the Green Data Products team will provide a demo or hindcast file on request.
Subscribe to our newsletter to keep up to date with all the latest news.