


James Luffman
July 3, 2024
Share this post
What is the spatial resolution of Solcast data?
We get this question a lot! Our answer is getting better and simpler over time:
"90 metres, using the highest-possible resolution of input data".
We used to tie ourselves in knots trying to explain the different resolutions of the input data we use, which range from 90 metres to about 20 km. However, over time we learnt that this detail is not so relevant to the fundamental resolution question. That's because we downscale and interpolate and model the input data right down to 90 metres.
We used to confuse customers too, leading them to assume our data was on a fixed grid. Sometimes, customers would even ask to know the grid point locations to query them more directly from our API!
How Solcast provides 90 metre resolution for solar irradiance data
When you request TMY, Historical Time Series, Live or Forecast data from the Solcast API, for any place on earth, you are always getting this full 90 metre resolution, as our back-end downscales and interpolates the input data and algorithms to your exact location. You will notice our data does indeed change at this 90 metre scale. If there is a lot of terrain or other geographical change around your location of interest, our data can vary significantly at this 90 metre scale.
This hyper-localisation of data is a consequence of Solcast's dedicated focus to solar energy, whereas more generalist weather data services cater to tens of different industry applications. In solar, very local details really matter.
Let's take a quick tour across the different scales of phenomena and input data, and talk about how data at each scale is downscaled or interpolated to 90 metre resolution.
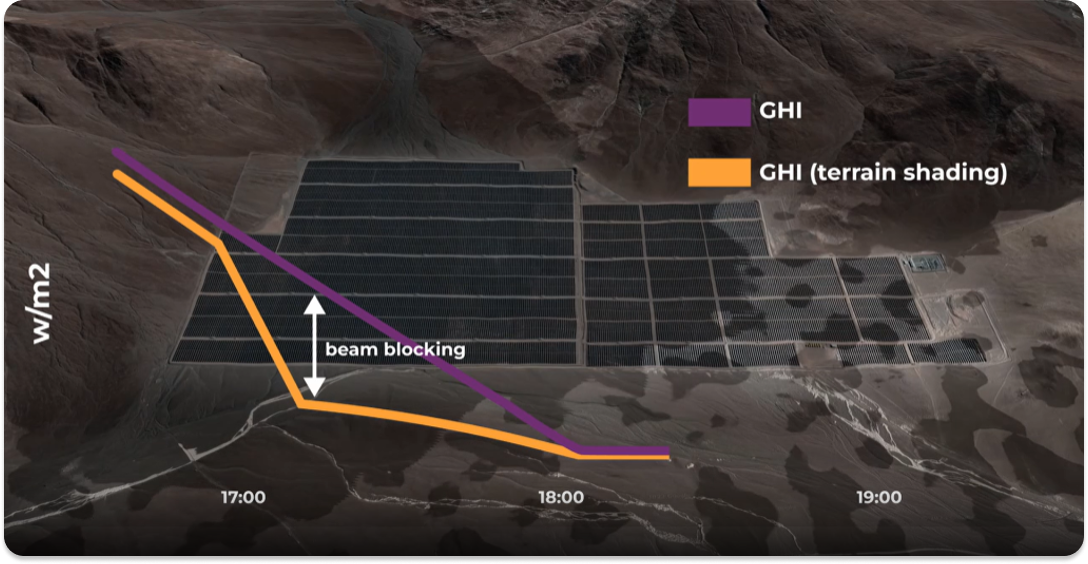
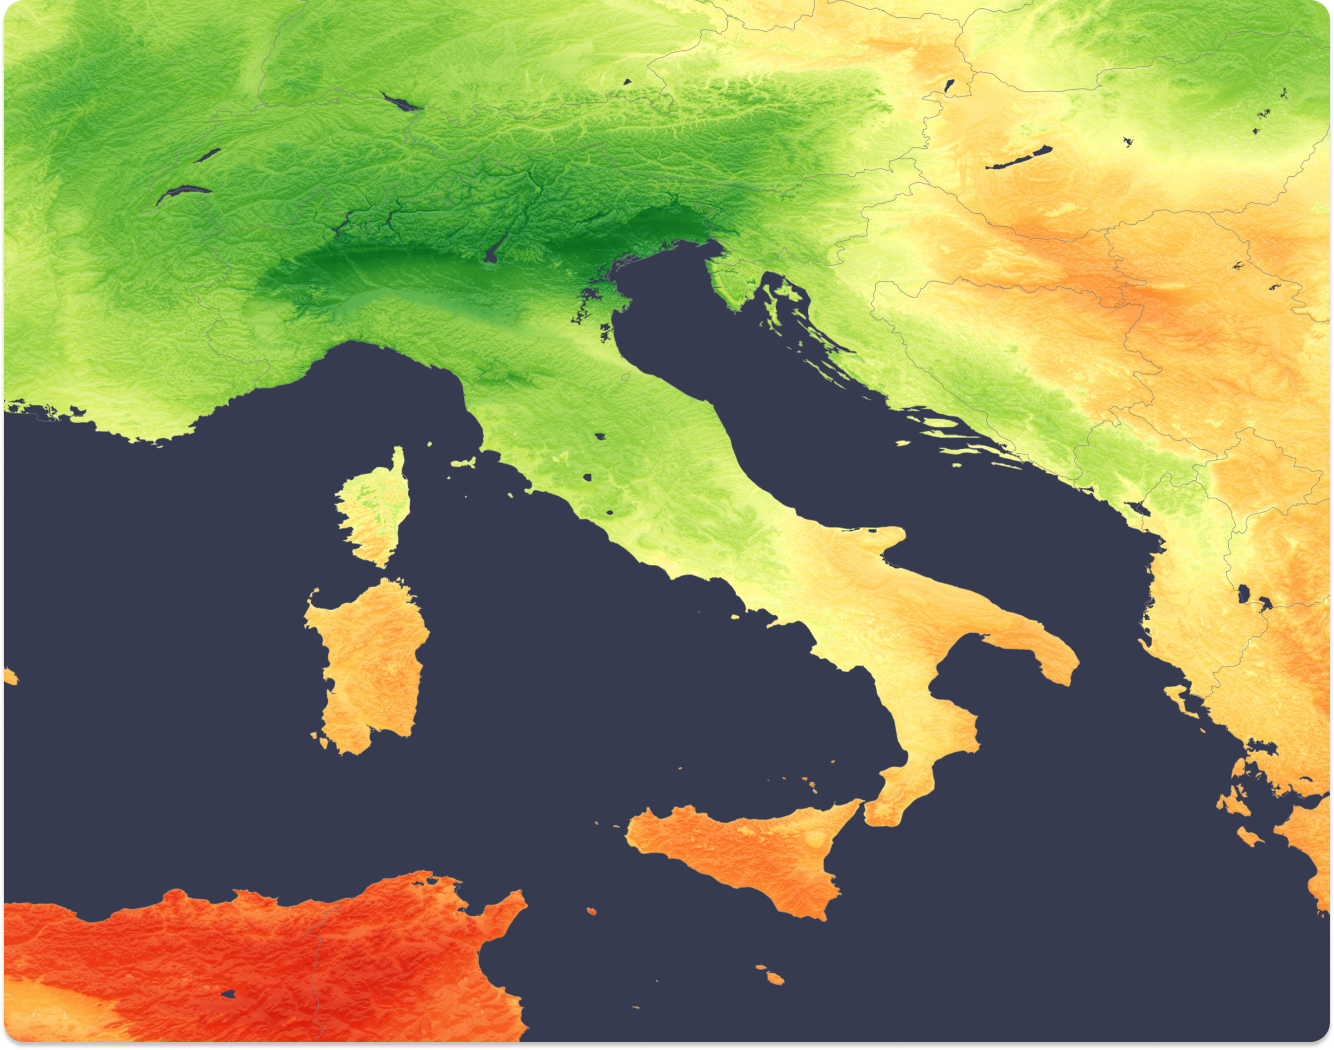
At the 90 metre scale, we "downscale" inputs that are particularly sensitive to topography. Firstly, we calculate the water vapour and air pressure inputs to our irradiance modelling, which can vary significantly over short distances near mountains, valleys or cliffs. Secondly, we calculate our aerosol (dust, smoke, haze etc.) inputs, to account for aerosol sensitivity to elevation. Lastly at this 90 metre scale, we also offer terrain shading for topographic shading effects to irradiance and PV power. If your solar asset is in a valley or near mountains, this can make a big difference. Why 90 metres and not 10 or 30 metres? Through experimentation, we have found 90 metres to be the best balance of terrain data quality, location specificity and also API performance.
How Solcast tracks cloud movements for accurate solar and weather data
At the 1-2km scale, we are tracking the movement and thickness of clouds, in 3D, every 5-15 minutes using raw satellite data and proprietary algorithms developed at Solcast since 2016. We interpolate these clouds down to the pinpoint location you make your data request for. For example, if there's a big thunderstorm right nearby, you'll experience the boundary between sunshine and darkness! Sometimes we call these "real clouds", comparing to the non-real clouds you get if you use data straight from weather models. The Solcast cloud tracking is higher resolution than these models, and crucially it's also much more tied to reality via more direct use of satellite data every 5-15 minutes.
For our forecast irradiance and PV power, we make special use of this 1-2km cloud data, using it to train machine learning models that improve on these weather models, allowing us to make a more accurate forecast that knows about the local cloud effects of each specific location.
Lastly, at the coarser 4-20km scale, we are tracking general weather information like humidity and wind speed. Like with the clouds, we interpolate these data inputs to the pinpoint location you make your data request for, capturing gradients in this data caused by things like mountains, lakes or local weather systems. Why do we interpolate general weather information instead of downscaling it? There are downscaling approaches available to us, in fact we already run some of them in-house for some special applications. However, so far we have found we can have the biggest impact on overall data quality by continuing to focus our effort and systems on improving the fundamentals of aerosols, clouds, irradiance and PV power that matters most to our users.
So, you don't need to worry about resolution or grids. Simply use your location's pinpoint latitude and longitude when making your Solcast API request, and our algorithms will take care of the rest for you. In as little as one-tenth of a second, Solcast takes care of all the complexity for you, and returns the most localised and accurate data you can get.
If you'd like to learn more, take a read more about our data inputs and algorithms or speak with our expert. Check the best plan for your assets.