


Latest
Filters
Latest


Solar Analysis
Strengthening El Niño to reshape global irradiance for the second half of 2026
Using four leading seasonal weather models and first-half 2026 observations, Solcast analyses how a strengthening El Niño is expected to reshape global solar irradiance in late 2026, showing regional outlooks and forecast confidence.
Solar Analysis

Solar Analysis
Blocking, El Niño and extreme events redistribute solar resource in 2026 so far
Europe experienced widespread irradiance gains, while El Niño, cloud, rainfall, dust and cyclones reshaped solar resource across North America, Asia, South America and Australia.
Solar Analysis
.png)

Product Updates
How we improved day-ahead solar forecasts by 9% with an attention-based model added to our ensemble
Solcast has improved day-ahead solar forecast accuracy by ~9% in North America using an attention-based ensemble correction layer that targets systematic errors in NWP models. The update improves the reliability of short-term forecasts used for dispatch planning and operational decision-making.
Product Updates
Solar Analysis
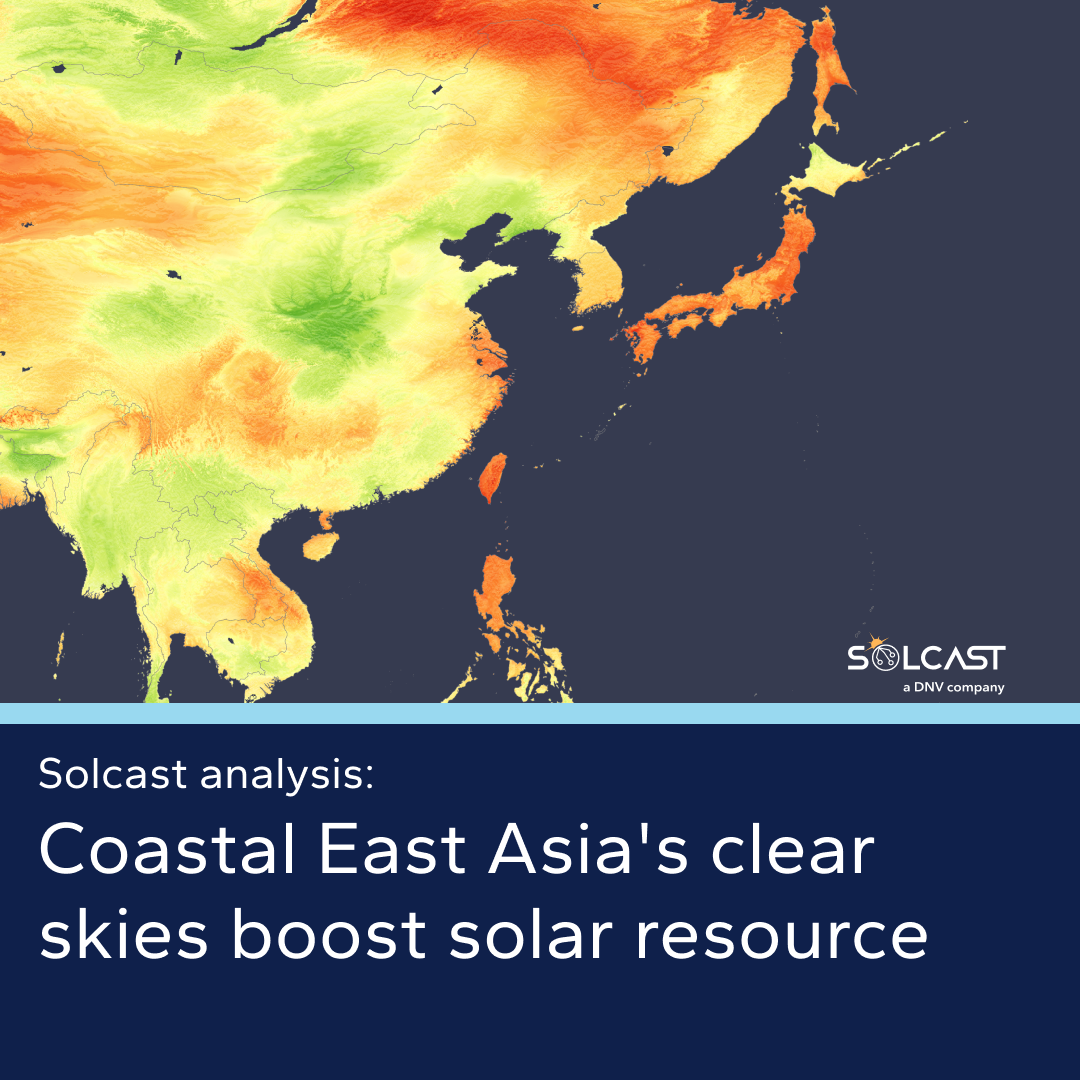
East Asia’s sunny May lifts coastal irradiance above average as El Niño builds
Coastal East Asia experienced one of its sunniest Mays in years, with irradiance gains across Japan, Korea, eastern China, Taiwan and the northern Philippines, while inland China saw heavier late-month rainfall.
Solar Analysis

Solar Analysis
Developing El Niño set to reshape global solar resource
The developing El Niño is expected to strengthen through 2026, and analysis of past strong El Niño events in 2009, 2015 and 2023 shows how sharply solar resource shifts between regions during the July–September window.
Solar Analysis

Product Updates
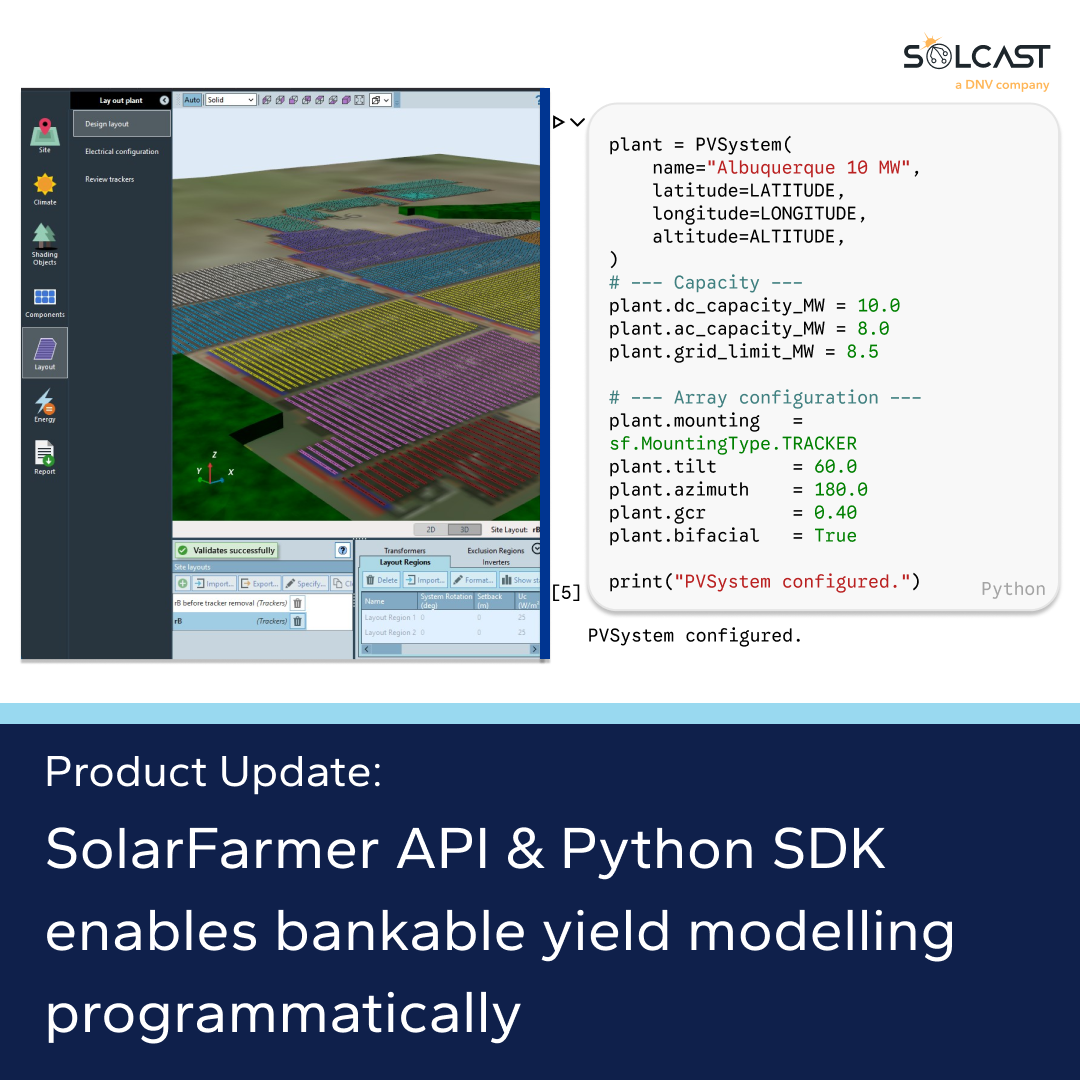
SolarFarmer 3D API: What a digital first yield engine changes for solar project finance
As solar projects grow more complex, SolarFarmer’s 3D API brings bankable yield modelling into Python workflows, making sensitivity analysis, verification and portfolio-scale automation easier to run and repeat.
Product Updates

Insights
Advanced PV or Premium PV: A practical guide to choosing the right forecasting model
A comparison of Solcast’s Advanced and Premium PV Power models—how they work and when to use them. Designed to help you choose the right approach for your data, resources, and operational needs.
Insights
Solar Analysis
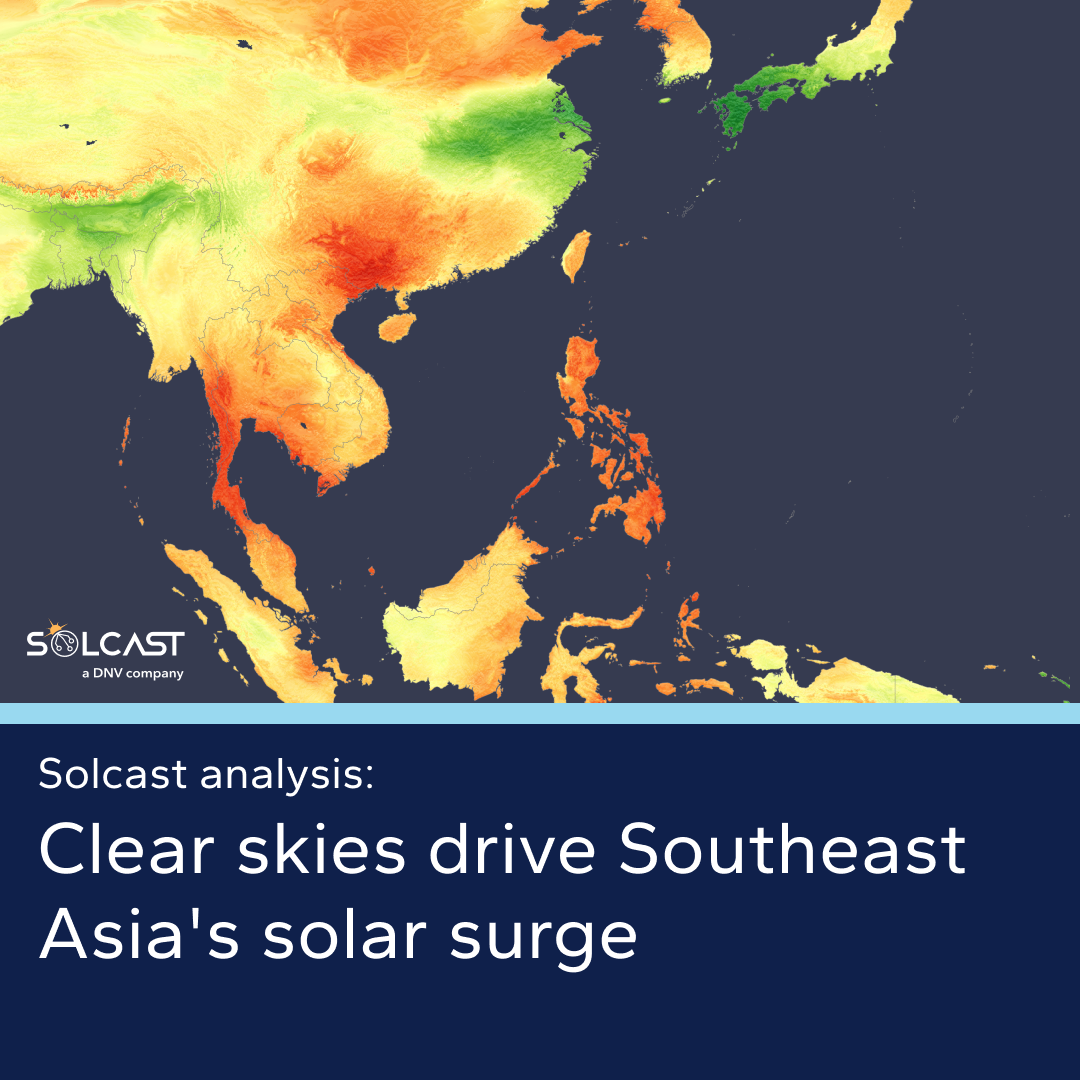
Southeast Asia surged under clear skies while Japan’s storms capped solar gains
Southeast Asia recorded above-average solar irradiance in April 2026, with Bangkok experiencing its sunniest April on record, while Japan and South Korea saw weaker solar performance amid storm activity.
Solar Analysis
Product Updates
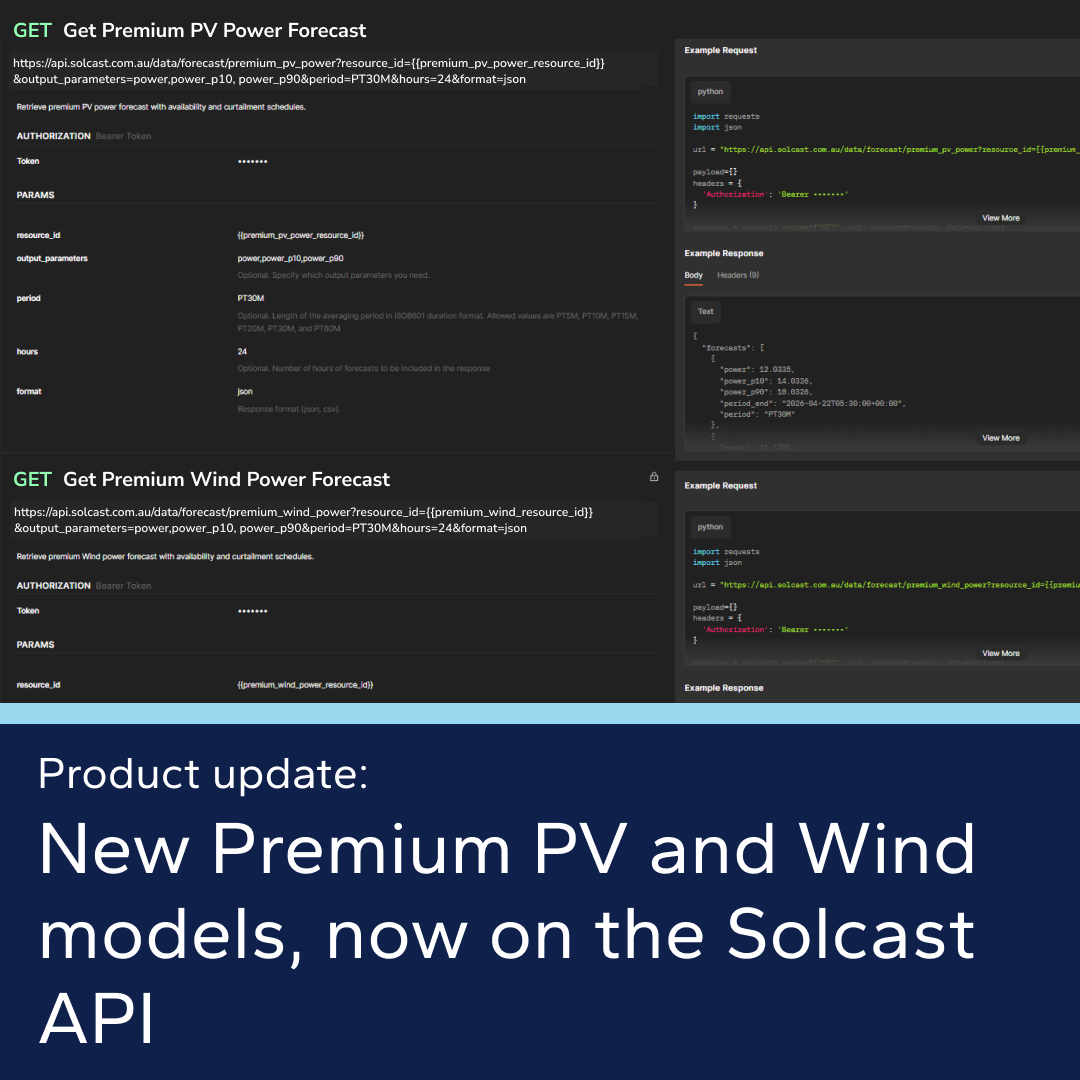
New: Premium PV & Wind — our most comprehensive forecast and first wind product
Introducing Premium PV & Wind — our most comprehensive forecasting and first dedicated wind product, now on the Solcast API.
Product Updates

Solar Analysis
Developing El Niño points to stronger solar conditions across Australasia and South Asia
The June, July and August 2026 seasonal outlook points to a broadly neutral to positive irradiance conditions across many key markets, with clearer regional patterns emerging as the season progresses.
Solar Analysis