


Typical Meteorological Year
Download a statistically representative “typical year” file built from 15 + years of satellite data for long-term yield modelling.
Bias and error validation of Solcast data against surface measurements
.avif)
The purpose of this analysis is to enable users to estimate Solcast real-time and forecast accuracy for their site(s) prior to subscription or integration effort. It is based on 12 months of recent Solcast forecast and estimated actuals data, compared to surface measured actuals from high-quality measurement sites.
Also included are error statistics, and benchmarks against common alternatives. Users focused on historical data or TMYs will find a separate, multi-year analysis on the Solcast website. This document analysis irradiance (GHI, DNI, GTI) and power production (fixed-tilt and single-axis tracking).
For brevity, a selection of commonly used statistics are included, summarised by climate type. You can explore an interactive map providing a visual view of our forecast accuracy validation. For a full range of statistics, at site level, and to request the raw data, please contact the Solcast team.
Solcast operates a global cloud tracking and forecasting system, using near-real-time satellite imagery from 11 weather satellites, and weather data from 7 numerical weather prediction (NWP) models. These inputs are used to make irradiance and PV power data, which is distributed via the Solcast API (Application Programming Interface), which enables automated, synchronous data requests for any point on earth.
This analysis focuses on live and forecast data, from -7 to +14 days from now. The live and forecast data products deliver PV power, irradiance, and weather data globally, at time granularities of 5, 10, 15, 30 and 60 minutes. Coverage is global, with spatial resolution of 90 metres and data updates every 5 to 15 minutes.
As part of our ongoing commitment to provide accurate, high-resolution solar forecasts to the energy industry, we are pleased to share the results of our latest forecast accuracy validation study. We believe that transparency is key to trusting your forecast data, so we're publishing this global, interactive, forecast accuracy dataset to make it easier to quantify the value and impact you can have with a forecast dataset built specifically for solar.
This analysis has been completed using trusted, validated, independently recorded irradiance measurements, and is offered in an interactive format that supports filtering sites for region and climate zone, plus selection of metrics and other key parameters. To enable direct comparison, we have also provided statistics for Global Forecast System (GFS) and smart persistence models.
Use the below drop down boxes to select the combination of sites you want data for, and using the interactive map, or the source data below it, you can see data for individual sites. As always, if you would like to see the underlying data for any site - just ask our team.
As we continue to refine and expand our validation processes, this study represents an important milestone in our journey towards even greater forecast accuracy. The detailed metrics provided in this study not only validate our current models but also set the stage for further improvements and innovations in the future.
Accuracy is typically the most important product attribute amongst commercial users of the Solcast API. Customer evaluations or trials can produce definitive results; however they require a large amount of resource, expertise, and elapsed time to gather and analyse the data, and to quality control the surface measurements.
Recently new high resolution mesoscale models have been made available in Europe and North America. Our early analysis shows estimated improvements in the short term, up to day ahead forecasts of up to ~5-10% error improvement. If you would like to understand more about these changes, check the Europe and North America improvements.
Solcast’s industry-leading forecast accuracy was recently proven in a large-scale, independently run trial - conducted by EPRI. The results show that Solcast achieved the lowest forecast error compared to other commercial solar forecast providers, which reaffirms why Solcast data is used in the management of over 300GW of assets globally. You can read more about the forecast trial and our data performance.
Accuracy is typically the most important product attribute amongst commercial users of the Solcast API. Customer evaluations or trials can produce definitive results; however they require a large amount of resource, expertise, and elapsed time to gather and analyse the data, and to quality control the surface measurements.
Two commonly available benchmarks are included, to put accuracy performance in context, and to assess the marginal value of Solcast data. For day-ahead forecasts and real-time estimated actual Live data, the benchmark is the Global Forecast System (GFS) model from NOAA, a commonly-used global weather forecast model. For simplicity, GFS data is taken at +24 hours ahead, even for intraday comparisons, because global weather models such as GFS are not available until ~5 hours after real time. For intra-day forecasts (i.e. +1 and +2 hours), we also include a benchmark called Smart Persistence, which is created by persisting the last hour's clearness index (i.e. the level of cloudiness is persisted, but clear-sky irradiance updates). This means the Smart Persistence benchmark is aware of sun position, and does not, for example, persist irradiance values after sunset).
Sites with very high elevation (over 2000 metres) have been excluded due to limited applicability to solar energy applications. Otherwise, all sites with data available during the analysis period are included. Across these three networks a total of 33 sites are included. For climate type categorisation, two dimensions are used: (1) the latitude zone (Tropical/Subtropical being latitudes equatorward of 35 degrees, and Temperate being latitudes between 35 and 60 degrees north and south (no sites poleward of 60 degrees are included); and (2) site climate type based on annual average precipitation (Humid being sites of greater than 750mm per year, Arid sites are less than 350mm per year, and Semi-Arid sites are between 350mm and 750mm per year) based on the CPC Merged Analysis of Precipitation (CMAP) from NOAA.
Solcast does not perform site-specific adaptation of its satellite-derived data (i.e. measurements from a site are not used in the dataset for that site), and the period of this analysis is not used in any regional algorithmic calibrations.
Map of measurement sites included in the analysis. Of the 33 included sites, a total of 18 are designated Tropical/Subtropical (7 Humid, 1 Semi-Arid, 10 Arid). A total of 15 are designated Temperate (8 Humid, 4 Semi-Arid, and 3 Arid).

During the 12-month period covering April 2020 to March 2021 inclusive, measurement data is 88% complete on average. All data were converted to hourly means prior to analysis. Forecast horizons available from the Solcast archive at the time were +1 hour, +2 hours and day-ahead only. A range of error statistics were calculated following "Metrics for Evaluating the Accuracy of Solar Power Forecasting" (NREL, 2013), including normalisation by AC capacity in the case of PV power. For irradiance statistics, normalisation uses the mean observed irradiace at that site.
Actuals power production data was derived by converting measured irradiance to power using Solcast's PV power model, which is based on the open source pvlib python tool with proprietary extensions, and adding noise in the irradiance to power conversion. The approach of simulating PV production rather than using actual plant data was chosen for the following reasons: (1) allows irradiance and power statistics to be available for the same sites; (2) ensures transparency and repeatability of results by users; (3) ensures a broad geographical spread of sites; (4) avoids conflation from plant availability and curtailment on accuracy statistics (in any case, users can specify real-time plant conditions in API requests). The plant specifications used are the Solcast defaults for 10MW Utility Scale sites, including an inverter loading ratio of 1.30. A noise model was used to model the error in the PV power model itself, in order to make accuracy results realistic. The noise model was trained on PV plant measurements and corresponding Solcast PV model estimates from ten sites globally where full plant specifications have been given to the PV model. PV Power and GTI, which use a Hay transposition model are not calculated unless a site has both GHI and DNI measurement.
This analysis excludes probabilistic statistics, because most users only require deterministic statistics. Users interested in probabilistic measures may note that forecast data from the Solcast API does include probabilistic 10th and 90th percentile values, which are dynamically generated using a combination of satellite cloud tracking and a range of NWP models.
Nocturnal zero values are included in this verification for hourly measures; users interested in daytime results only for hourly values can approximate results via doubling the error values listed here. For daily total energy values, there is no difference in statistics owing to inclusion of nocturnal values, so the statistics presented here remain directly applicable.
The following tables show statistics for the Mean Absolute Percentage Error (MAPE), as defined in the above-mentioned NREL 2013 paper, of power production for single 10MW PV plants with horizontal single axis tracking. The statistics are grouped by climate type and latitude zone. For a complete range of statistics and PV system types, and results for specific measurement sites, please contact Solcast.
MAPE (%) errors of Day-ahead PV Power Forecasts Measure: Daily total energy production (single-axis-tracking) | ||||||
|---|---|---|---|---|---|---|
Site type | Data source | Day-ahead (+24hr) error (%) | ||||
Global average | Solcast | 5.9% | Smart Persistence | 13.2% | GFS | 7.7% |
Tropical/Subtropical | Solcast | 4.4% | Smart Persistence | 7.6% | GFS | 5.8% |
Tropical/Subtropical | Solcast | 7.6% | Smart Persistence | 15.7% | GFS | 10.4% |
Temperate | Solcast | 6.0% | Smart Persistence | 11.1% | GFS | 8.1% |
Temperate | Solcast | 6.5% | Smart Persistence | 16.6% | GFS | 8.0% |
MAPE (%) errors of Intraday & Day-Ahead PV Power Forecasts Measure: Hourly energy production (single-axis-tracking), nocturnal zeros included | ||||||||||
|---|---|---|---|---|---|---|---|---|---|---|
Site type | Data source | +1 hours ahead error (%) | +2 hours ahead error (%) | Day-ahead (+24hr) error (%) | ||||||
Global average | Solcast | 2.9% | 4.1% | 5.1% | Smart Persistence | 4.0% | 5.2% | 9.0% | GFS | 6.0% |
Tropical/Subtropical | Solcast | 2.3% | 3.1% | 3.9% | Smart Persistence | 3.0% | 4.1% | 5.8% | GFS | 4.6% |
Tropical/Subtropical | Solcast | 3.0% | 4.5% | 6.1% | Smart Persistence | 4.4% | 5.8% | 10.1% | GFS | 7.3% |
Temperate | Solcast | 3.8% | 4.8% | 5.3% | Smart Persistence | 4.9% | 6.0% | 10.0% | GFS | 6.1% |
Temperate | Solcast | 2.9% | 4.2% | 5.5% | Smart Persistence | 4.3% | 5.5% | 10.8% | GFS | 6.4% |
The following tables show statistics for the normalised Root Mean Square Error (nRMSE), as defined in the above-mentioned NREL 2013 paper, of GHI irradiance. For a full range of statistics (including DNI and GTI), at site level, and to request the raw data, please contact the Solcast team.
nRMSE (%) errors of Intraday & Day-Ahead Irradiance Forecasts & Estimated Actuals Measure: GHI hourly average, daytime only, scaled by mean observation | ||||||||||||
|---|---|---|---|---|---|---|---|---|---|---|---|---|
Site type | Data source | Real-time | +1 hour | +2 hour | +24 hour | |||||||
Global average | Solcast | 15.6% | 16.6% | 22.6% | 27.4% | Smart Persistence | N/A | 22.9% | 29.2% | 47.9% | GFS | 33.9% |
Tropical/Subtropical | Solcast | 10.4% | 10.8% | 14.2% | 16.7% | Smart Persistence | N/A | 14.3% | 18.6% | 26.6% | GFS | 19.4% |
Tropical/Subtropical | Solcast | 17.2% | 19.3% | 27.3% | 34.8% | Smart Persistence | N/A | 26.5% | 33.1% | 55.4% | GFS | 43.9% |
Temperate | Solcast | 20.0% | 20.5% | 25.2% | 28.0% | Smart Persistence | N/A | 26.7% | 33.1% | 52.0% | GFS | 35.8% |
Temperate | Solcast | 17.1% | 18.3% | 26.4% | 33.1% | Smart Persistence | N/A | 27.1% | 35.2% | 63.0% | GFS | 41.0% |

Download a statistically representative “typical year” file built from 15 + years of satellite data for long-term yield modelling.
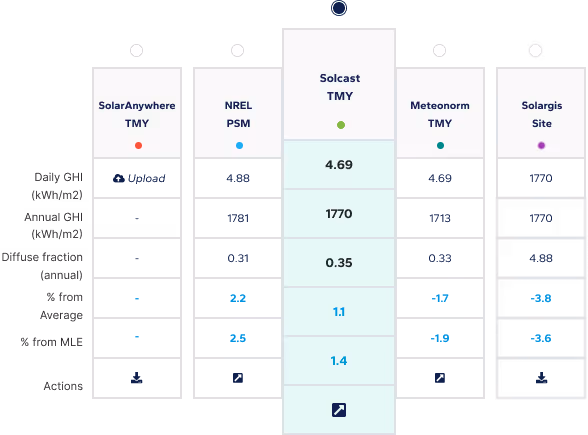
Compare multiple irradiance data sets side-by-side to choose the most bankable resource data for your projects.
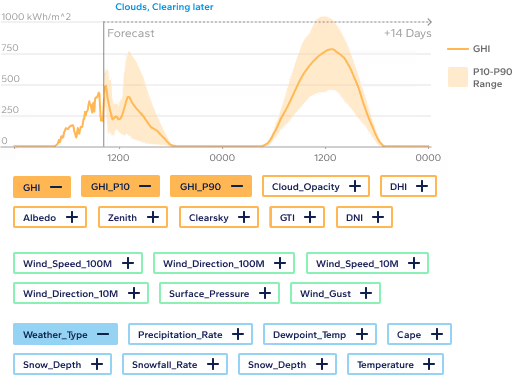
Access industry-leading solar forecasts up to 14 days ahead, combining satellite nowcasting and weather models for precision energy planning.
What makes a solar and PV forecast accurate?
The most accurate solar and PV forecasts integrate real-time satellite data, high-quality weather models, and advanced algorithms to predict irradiance and PV power output. Unlike generic weather models, Solcast specifically accounts for weather parameters that impact irradiance, like cloud cover, aerosols, snow soiling, terrain shading and more, to deliver high-resolution, accurate irradiance data for solar applications and PV forecasting.
How to estimate cloud cover for solar forecasting?
Tracking and modelling cloud cover involves using satellite imagery to detect and track cloud movements. Solcast then applies advanced algorithm models for its cloud tracking model, using a 90-metre resolution data updated every 5 to 15 minutes, for accurate cloud forecasts.
How to evaluate solar forecast data?
You can evaluate solar forecasts by comparing the forecasted values with actual observed data using metrics like Mean Absolute Error (MAE) and Root Mean Square Error (RMSE). Independent validation and consistency checks also help ensure accuracy and reliability. For more details, check our step-by-step guide on evaluating forecast irradiance data. Or check how Solcast live and forecast data performs in your location via the Live and Forecast Accuracy Map.
Subscribe to our newsletter to keep up to date with all the latest news.